Figure 5. Correlation of IL-33, IL-13, and IL-5 levels with ocular surface parameters. Only the eight graphs that indicated statistically
significant correlation are presented. A–D: In the DE group, the level of IL-33 positively correlated with the OSDI score (R=0.4483, P=0.0415, n=21) and CFS (R=0.5657,
P=0.0075, n=21) while negatively correlated with the Schirmer I test (R=-0.4448, P=0.0433, n=21) and BUT (R=-0.4459, P=0.0427,
n=21). E–F: The level of IL-13 positively correlated with the CFS (R=0.5005, P=0.0208, n=21) while negatively correlated with the Schirmer
I test (R=-0.4348, P=0.0433, n=21). G–H: The level of IL-5 positively correlated with both OSDI score (R=0.4551, P=0.0382, n=21) and CFS (R=0.5261, P=0.0143, n=21).
The levels of IL-33, IL-13, IL-5 in tears showed no correlation with ocular surface parameters in controls. Pearson correlation
coefficients. DE, dry eye.
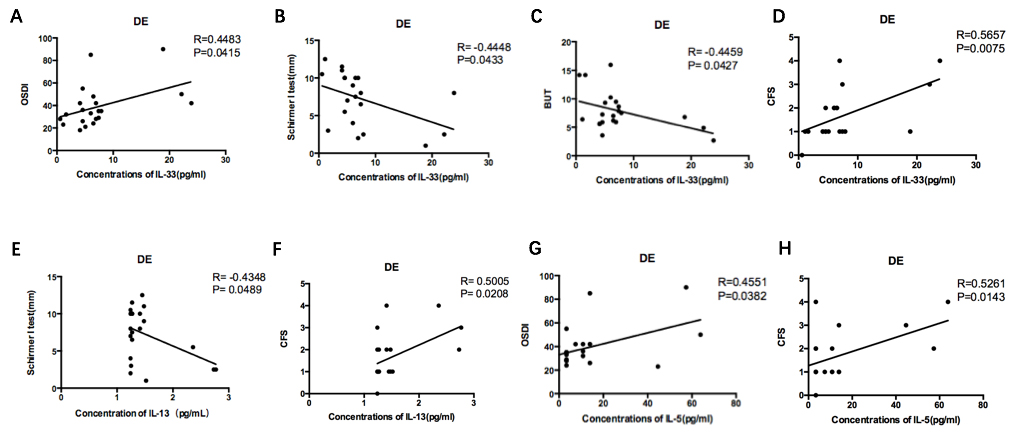
 Figure 5 of
Wang, Mol Vis 2019; 25:583-592.
Figure 5 of
Wang, Mol Vis 2019; 25:583-592.