Figure 8. Cebpb expression is increased in Cx50D47A/D47A lenses, and deletion of Chop in Cx50D47A/D47A mice reduces this increase. A: Graph showing the fold change of transcript levels for Cebpb as determined by real-time quantitative PCR (RT-qPCR) in 1-month-old homozygous Cx50D47A lenses relative to those in their
wild-type littermates. B: Graph showing the fold change of transcript levels for Cebpb as determined by RT-qPCR in 1-month-old lenses from homozygous Cx50D47A mice that were heterozygous (Chop+/−-Cx50D47A/D47A) and homozygous (Chop−/−-Cx50D47A/D47A) Chop knockout relative to the levels in lenses from their littermates that were wild type for Chop (Chop+/+-Cx50D47A/D47A). The values obtained in each of three independent biological replicates are shown in different symbols (each representing
a different set of mouse littermates containing all genotypes). The bars represent the geometric mean of the fold change obtained
in the biological replicates. The value obtained in Cx50+/+ littermates was considered as the reference in panel A, and the value obtained in Chop+/+-Cx50D47A/D47A littermates was considered as the reference in panel B (short dashed lines at fold change = +1 and −1). Asterisks indicate a significant difference (p<0.05) from the values in
the wild type (in panel A) and Chop+/+-Cx50D47A/D47A (in panel B).
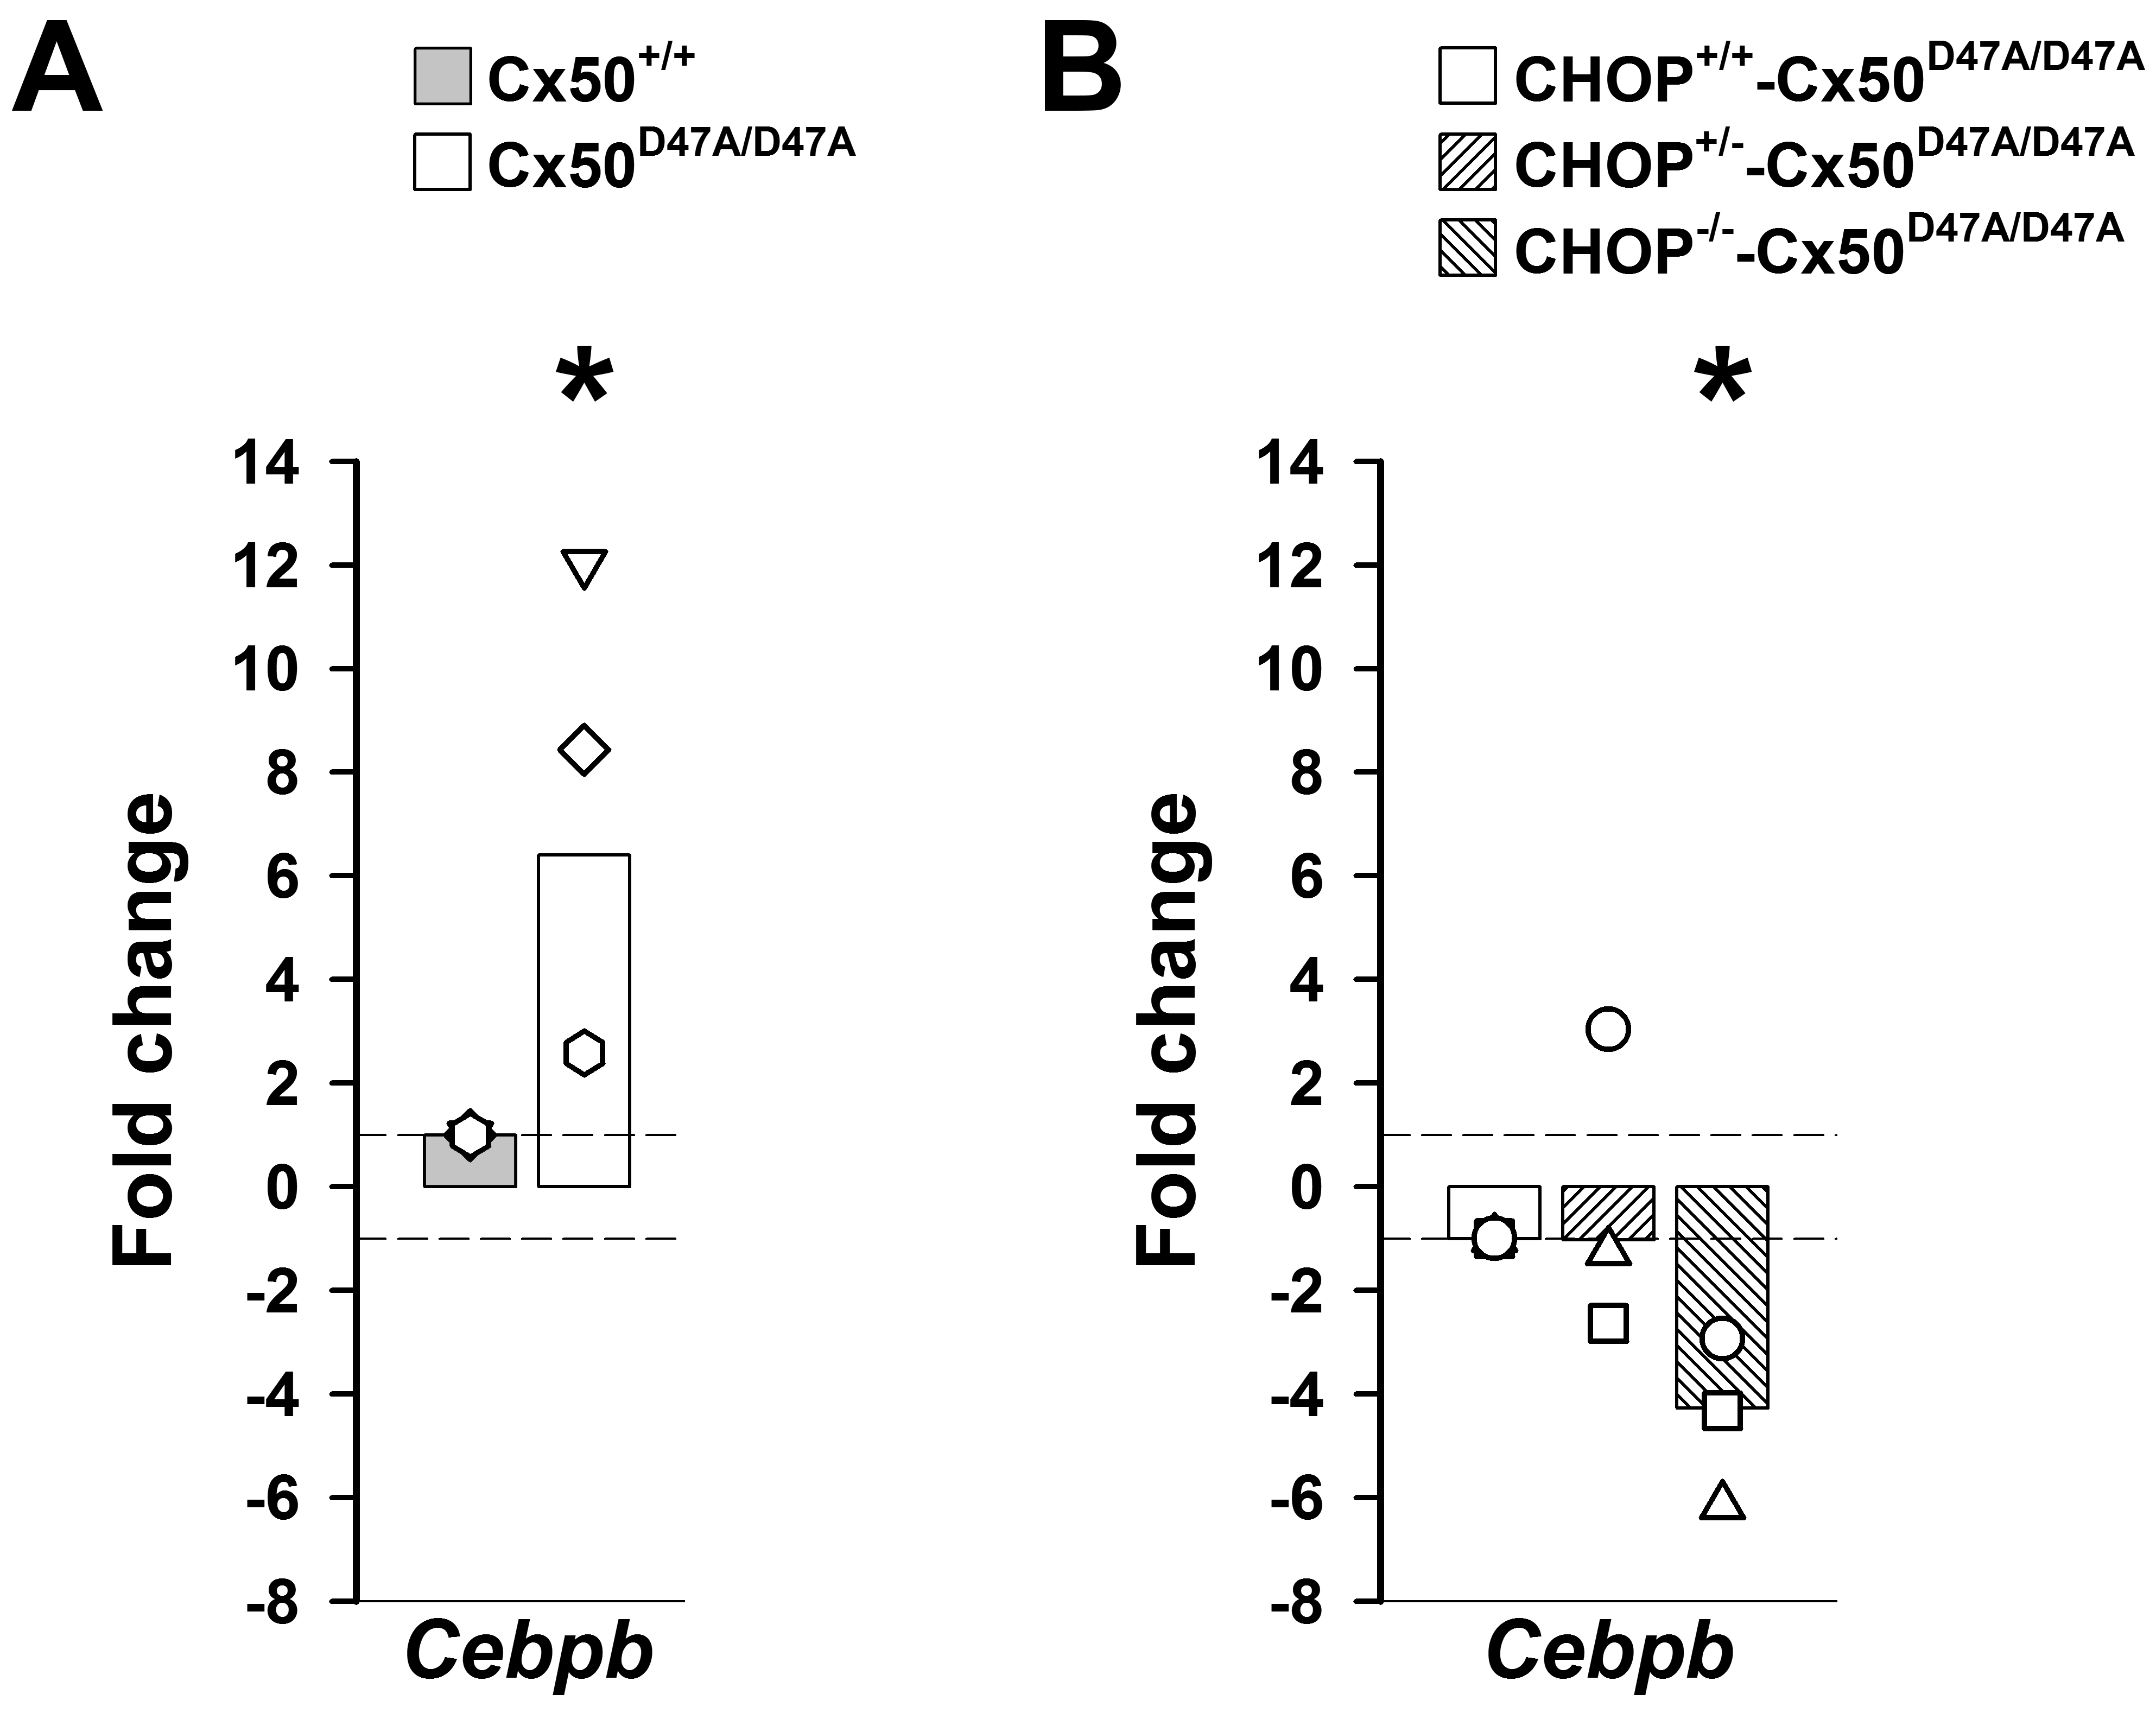
 Figure 8 of
Minogue, Mol Vis 2019; 25:535-545.
Figure 8 of
Minogue, Mol Vis 2019; 25:535-545.