Figure 2. Chop deletion was confirmed. A: Graph shows the fold change of Chop transcript levels in lenses from 1-month-old homozygous Cx50D47A mice that were Chop+/− and Chop−/− relative to levels of Chop+/+ (Chop+/+-Cx50D47A/D47A) lenses as determined by real-time quantitative PCR. The values obtained in each of three independent biological replicates
are shown with different symbols representing each set of littermates. The bars represent the geometric mean of the fold change
obtained in the biological replicates. The value obtained in Chop+/+-Cx50D47A/D47A mice was considered as the reference (short dashed line at fold change = −1). B: Immunoblot of CCAAT/enhancer-binding homologous protein (CHOP) in homogenates from lenses of 1-month-old homozygous Cx50D47A
littermates that were Chop+/+, Chop+/−, and Chop−/−. The migration positions of the molecular mass markers are indicated on the left. Graph shows the mean (bar) + standard error
of the mean of the densitometric values of the immunoreactive bands obtained from three biological replicates expressed in
arbitrary units (a.u.). Asterisks denote significant differences from Chop+/+-Cx50D47A/D47A values (p<0.05).
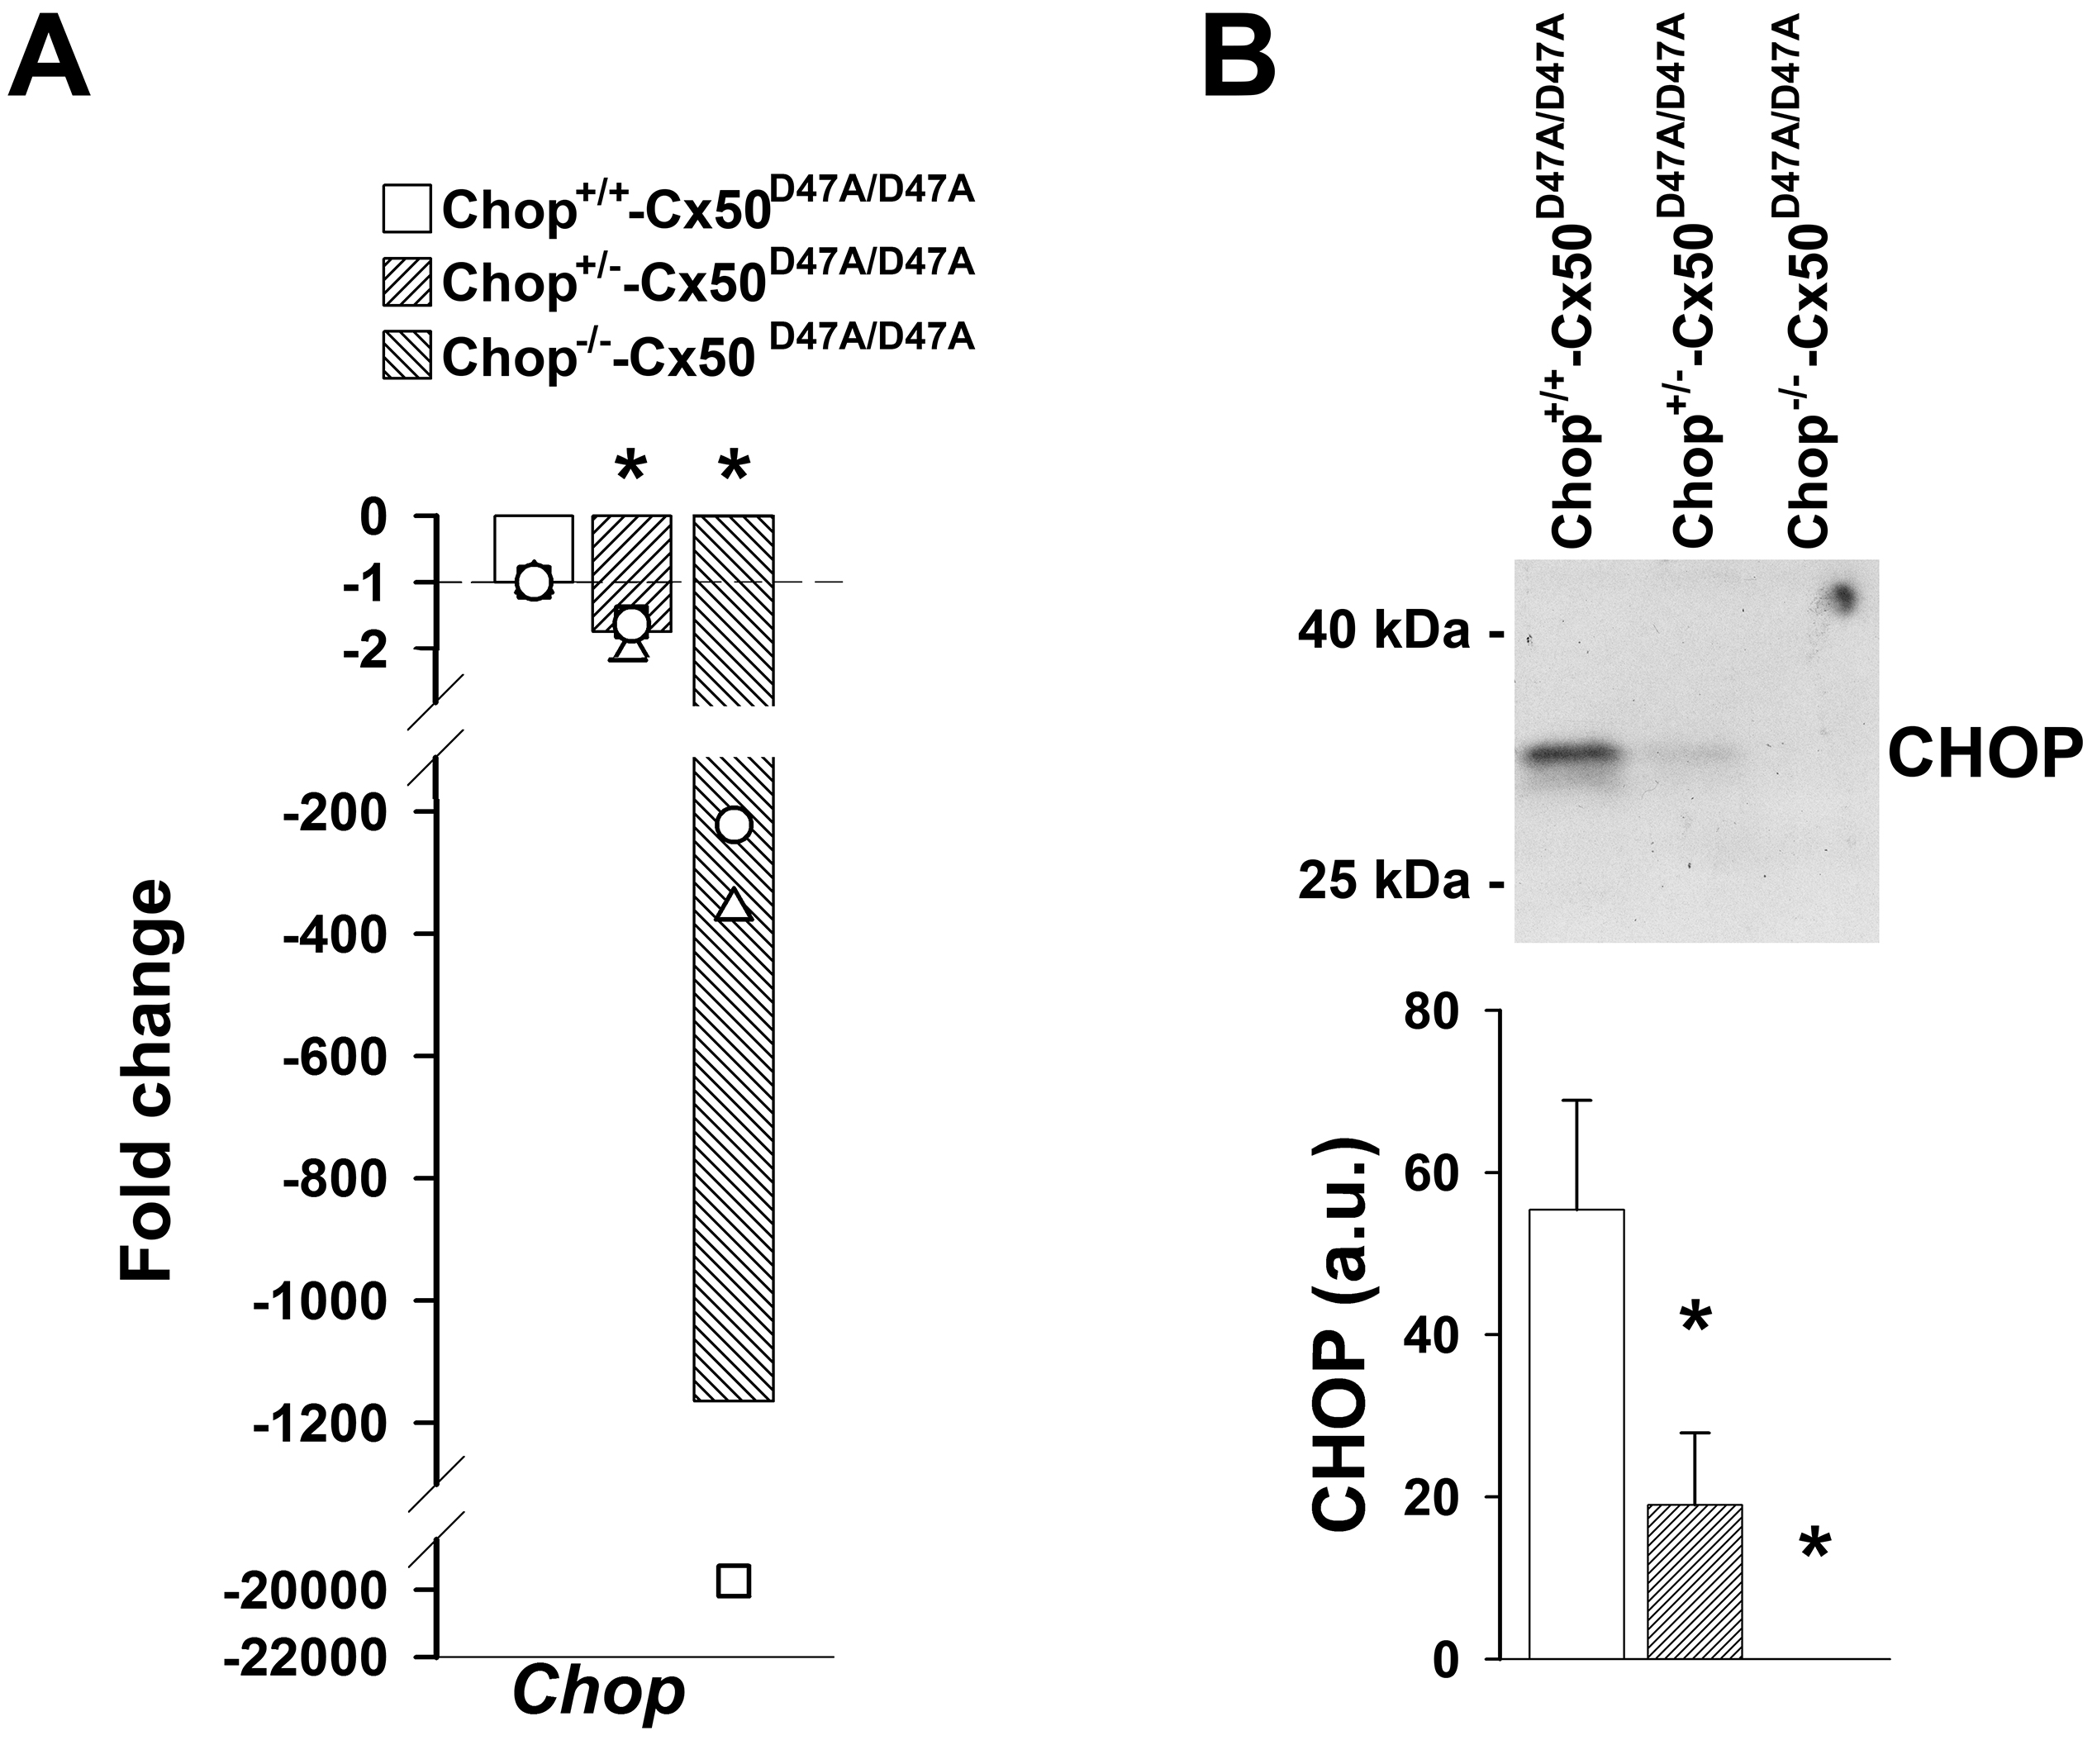
 Figure 2 of
Minogue, Mol Vis 2019; 25:535-545.
Figure 2 of
Minogue, Mol Vis 2019; 25:535-545.