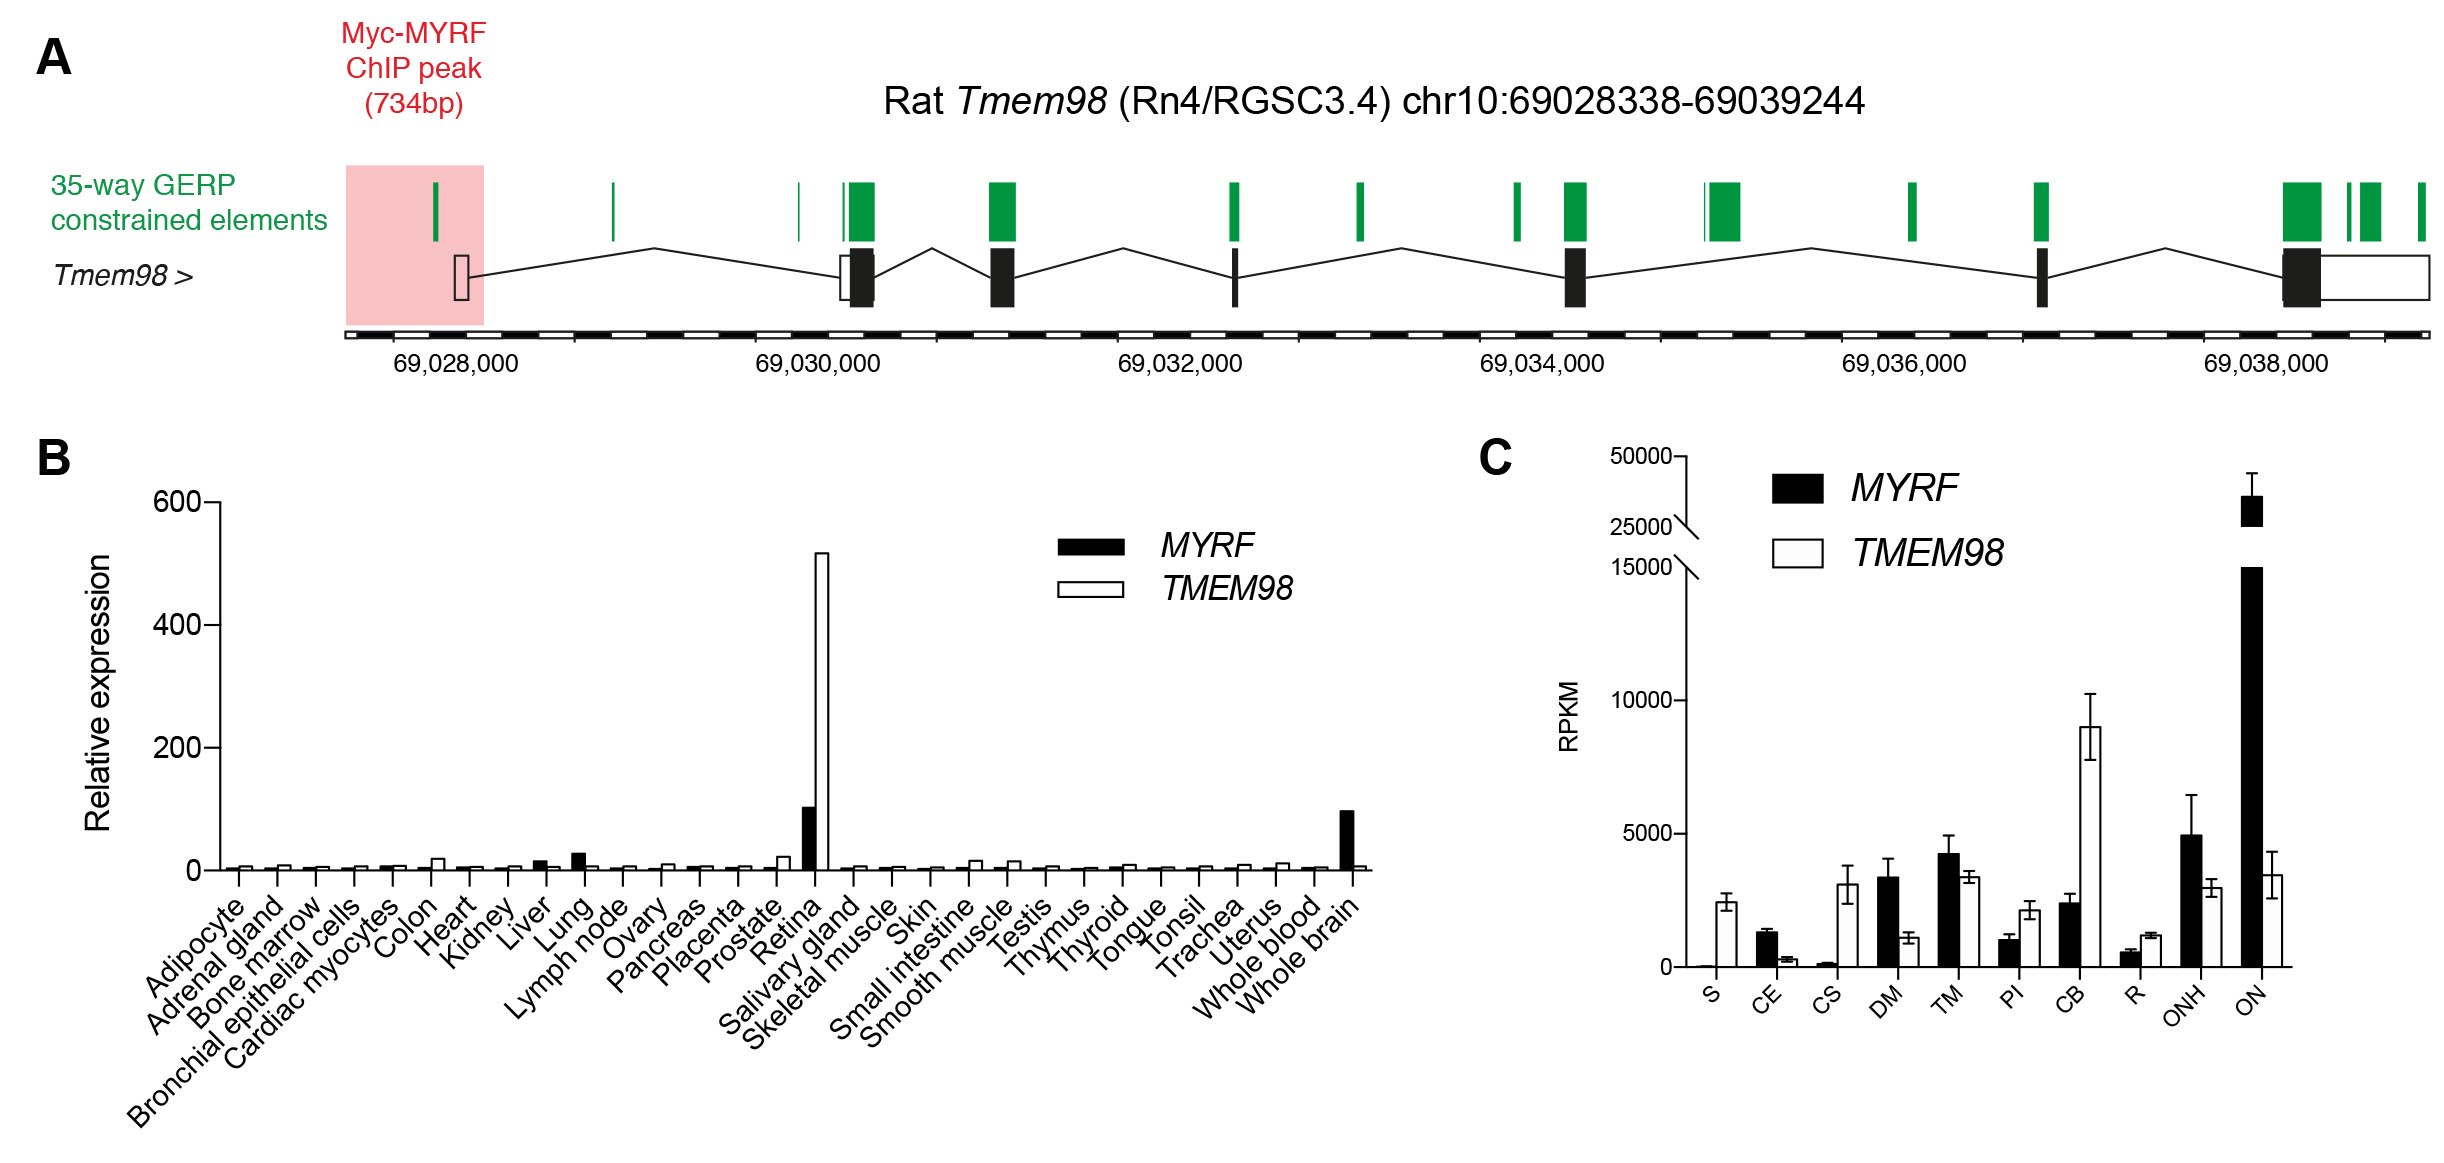
Figure 2. Coordinated expression of
MYRF and
TMEM98 in human and rodent tissues.
A: Myc-MYRF chromatin immunoprecipitation binding peak (highlighted in red) at the
Tmem98 locus in rat oligodendrocytes. Intervals constrained across 35 mammalian species are highlighted in green.
B: Mean expression of
MYRF and
TMEM98 in human tissue as measured with gene expression array [
21].
C: Expression of
MYRF and
TMEM98 transcripts in dissected human cadaveric eye tissue, represented as reads per kilobase per million mapped reads (RPKM). Bars
represent mean with standard error of the mean (SEM; n=5–7 biologic replicates per tissue). S, sclera; CS, corneal stroma;
CE, corneal epithelium; TM, trabecular meshwork; DM, Descemet’s membrane; ON, optic nerve; ONH, optic nerve head; PI, peripheral
iris; CB, ciliary body.
 Figure 2 of
Siggs, Mol Vis 2019; 25:527-534.
Figure 2 of
Siggs, Mol Vis 2019; 25:527-534.