Figure 2. Diagrammatic representation of ultrastructural analysis of JCT and GV analysis along the circumference of SC. A: Human trabecular meshwork (TM) was dissected and embedded in resin for serial block face scanning electron microscopy (SBF-SEM).
For purposes of this study, the data set was subdivided into four distinct regions (at 12.5, 25, 37.5, and 50 μm) starting
from the initial block face. Each region consisted of 100 micrographs. B: Moving through the slices of the image stack, the borders of Schlemm’s canal (SC) vary, and therefore, the borders of SC
were always manually traced and adjusted within each slice within each of the four regions. A macro was then used to create
six segments at a distance of 2.7, 5.4, 8.1, 10.8, 13.5, and 16.2 μm, upstream from the inner wall of SC (dotted line). The
optically empty spaces within each of the six segments were manually traced, the perimeter was calculated, and the percentage
of the volume occupied within each segment was determined.
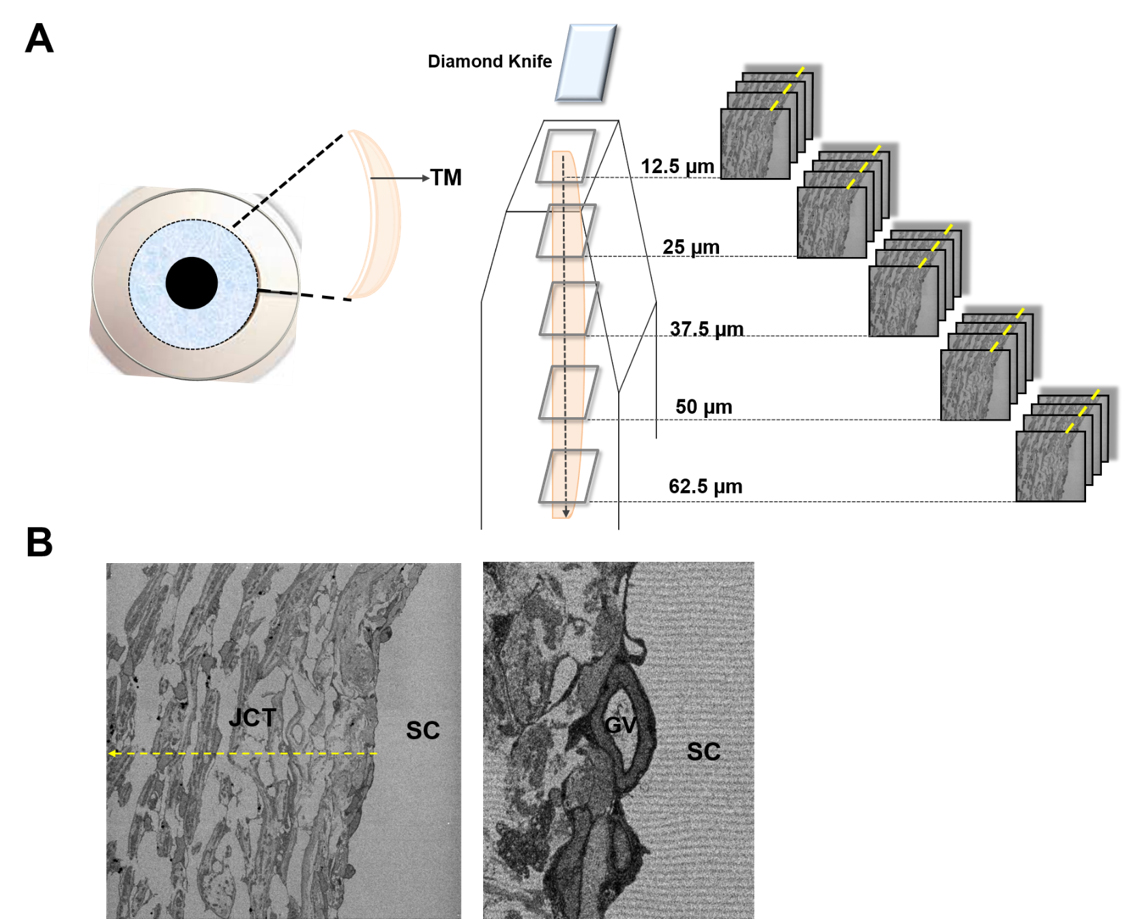
 Figure 2 of
Koudouna, Mol Vis 2019; 25:517-526.
Figure 2 of
Koudouna, Mol Vis 2019; 25:517-526.