Figure 2. Area density of CD31, laminin, and PAS positive patterns in uveal melanoma. A: Mean density of each marker, exemplified in B, which also illustrates the digital pattern recognition of each marker in this area (right panel, identified structures marked
yellow). C: Box plot showing periodic acid-Schiff (PAS) density (PAS positive pixels divided by the total number of pixels) versus the
presence (red) or no presence (green) of vasculogenic mimicry, defined as networks, closed loops, or arcs with branching,
or any combination (Mann–Whitney U test p=0.04). D: PAS density versus gene expression class 1a (green), 1b (yellow), or 2 (red; Kruskal–Wallis p=0.02). E: PAS density versus level of BAP-1 expression high (green) or low (red) in tumor cell nuclei (Mann–Whitney U test p=0.004). F: PAS density versus no metastasis (green) or metastasis (red; Mann–Whitney U test p=0.01). Error bars represent 95% confidence interval. °=outlier, *=extreme outlier. Scale bar: 100 μm.
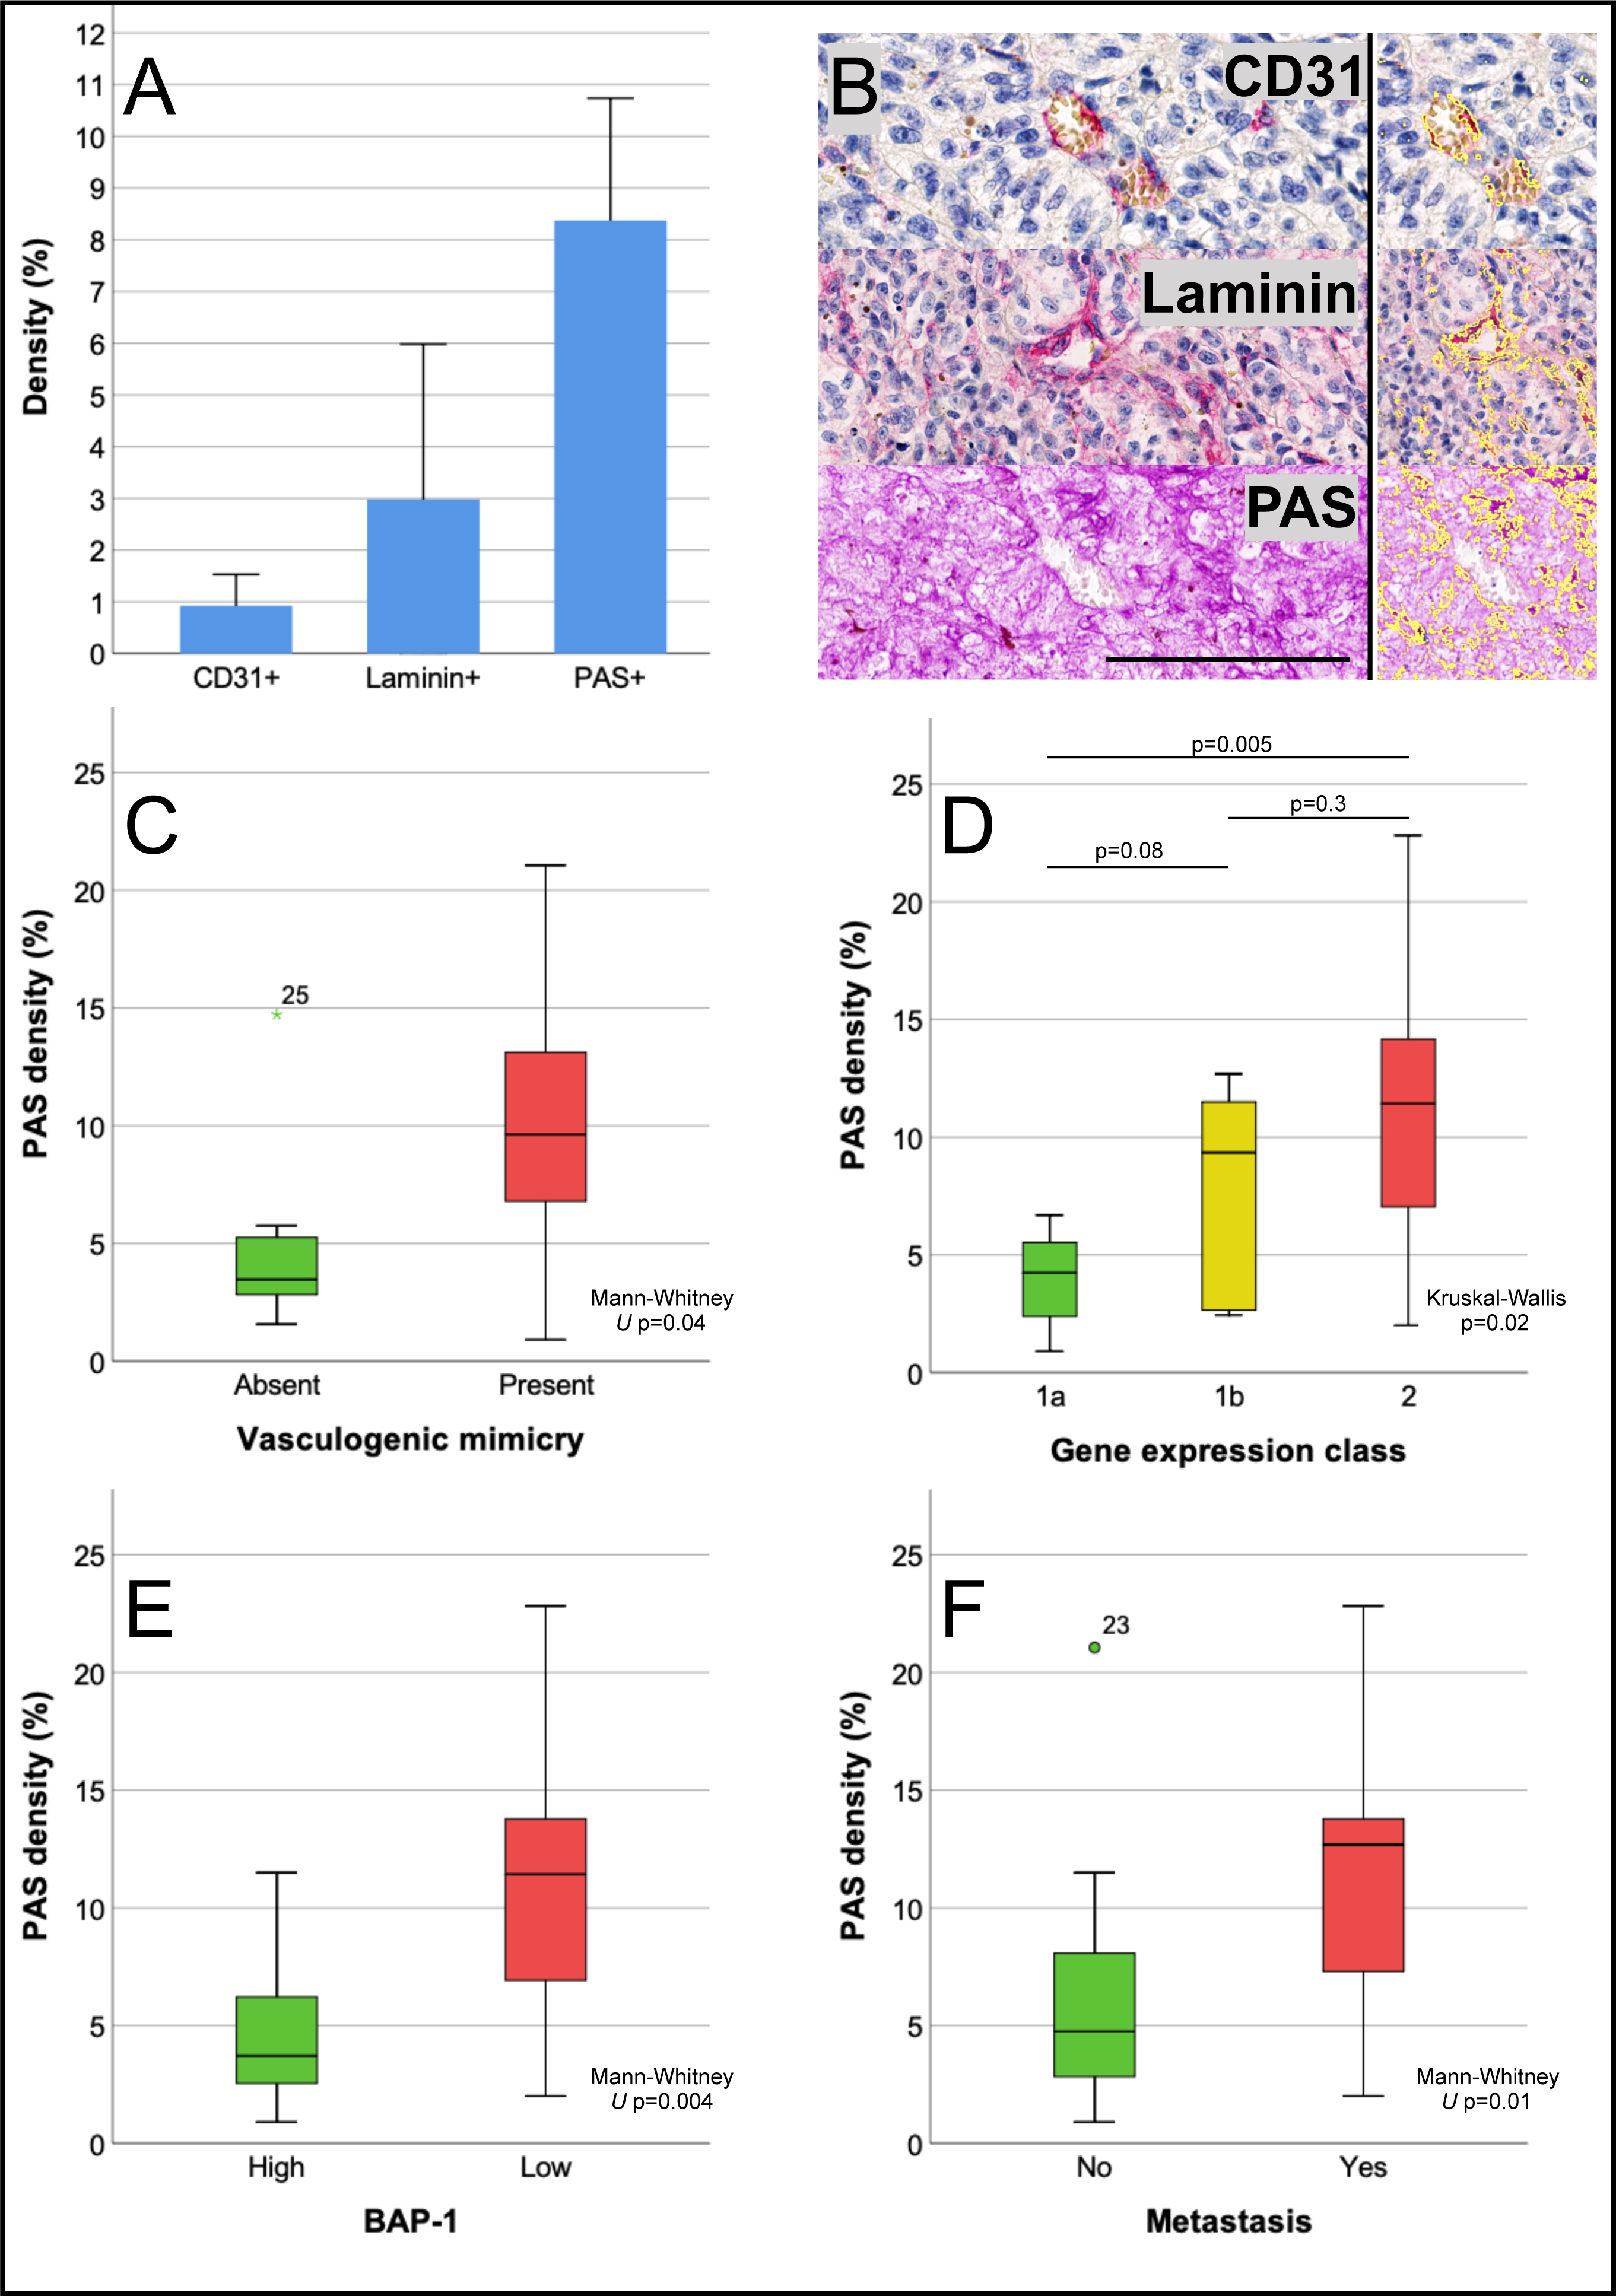
 Figure 2 of
Stålhammar, Mol Vis 2019; 25:502-516.
Figure 2 of
Stålhammar, Mol Vis 2019; 25:502-516.