Figure 1. Examples of digital pattern recognition of PAS positive structures. A: A glass slide with a dome-shaped uveal melanoma in the posterior aspect of the eye was digitally scanned and imported to
the QuPath Bioimage analysis software. B: In higher magnification, multiple periodic acid-Schiff (PAS) positive structures can be identified in the interior of the
tumor (arrows). C: A region of interest is outlined along the tumor’s margins (yellow line). Within this region of interest, the software automatically
identified PAS positive patterns (marked red). As indicated, the PAS density in this full tumor cross-section was 4.7% (PAS
positive pixels divided by the total number of pixels). D: In even higher magnification of the same tumor, vessels are easier to identify. E: The digital pattern recognition marked all PAS positive structures red. F: In a second tumor, patterns of vasculogenic mimicry (VM) including closed loops and networks can be identified. In the square
region of interest, the digital pattern recognition of the VM is visualized in red. The PAS density in the square region was
7.4%. Scale bars, a: 2 mm. b, c: 1 mm. d, e and f: 200 μm.
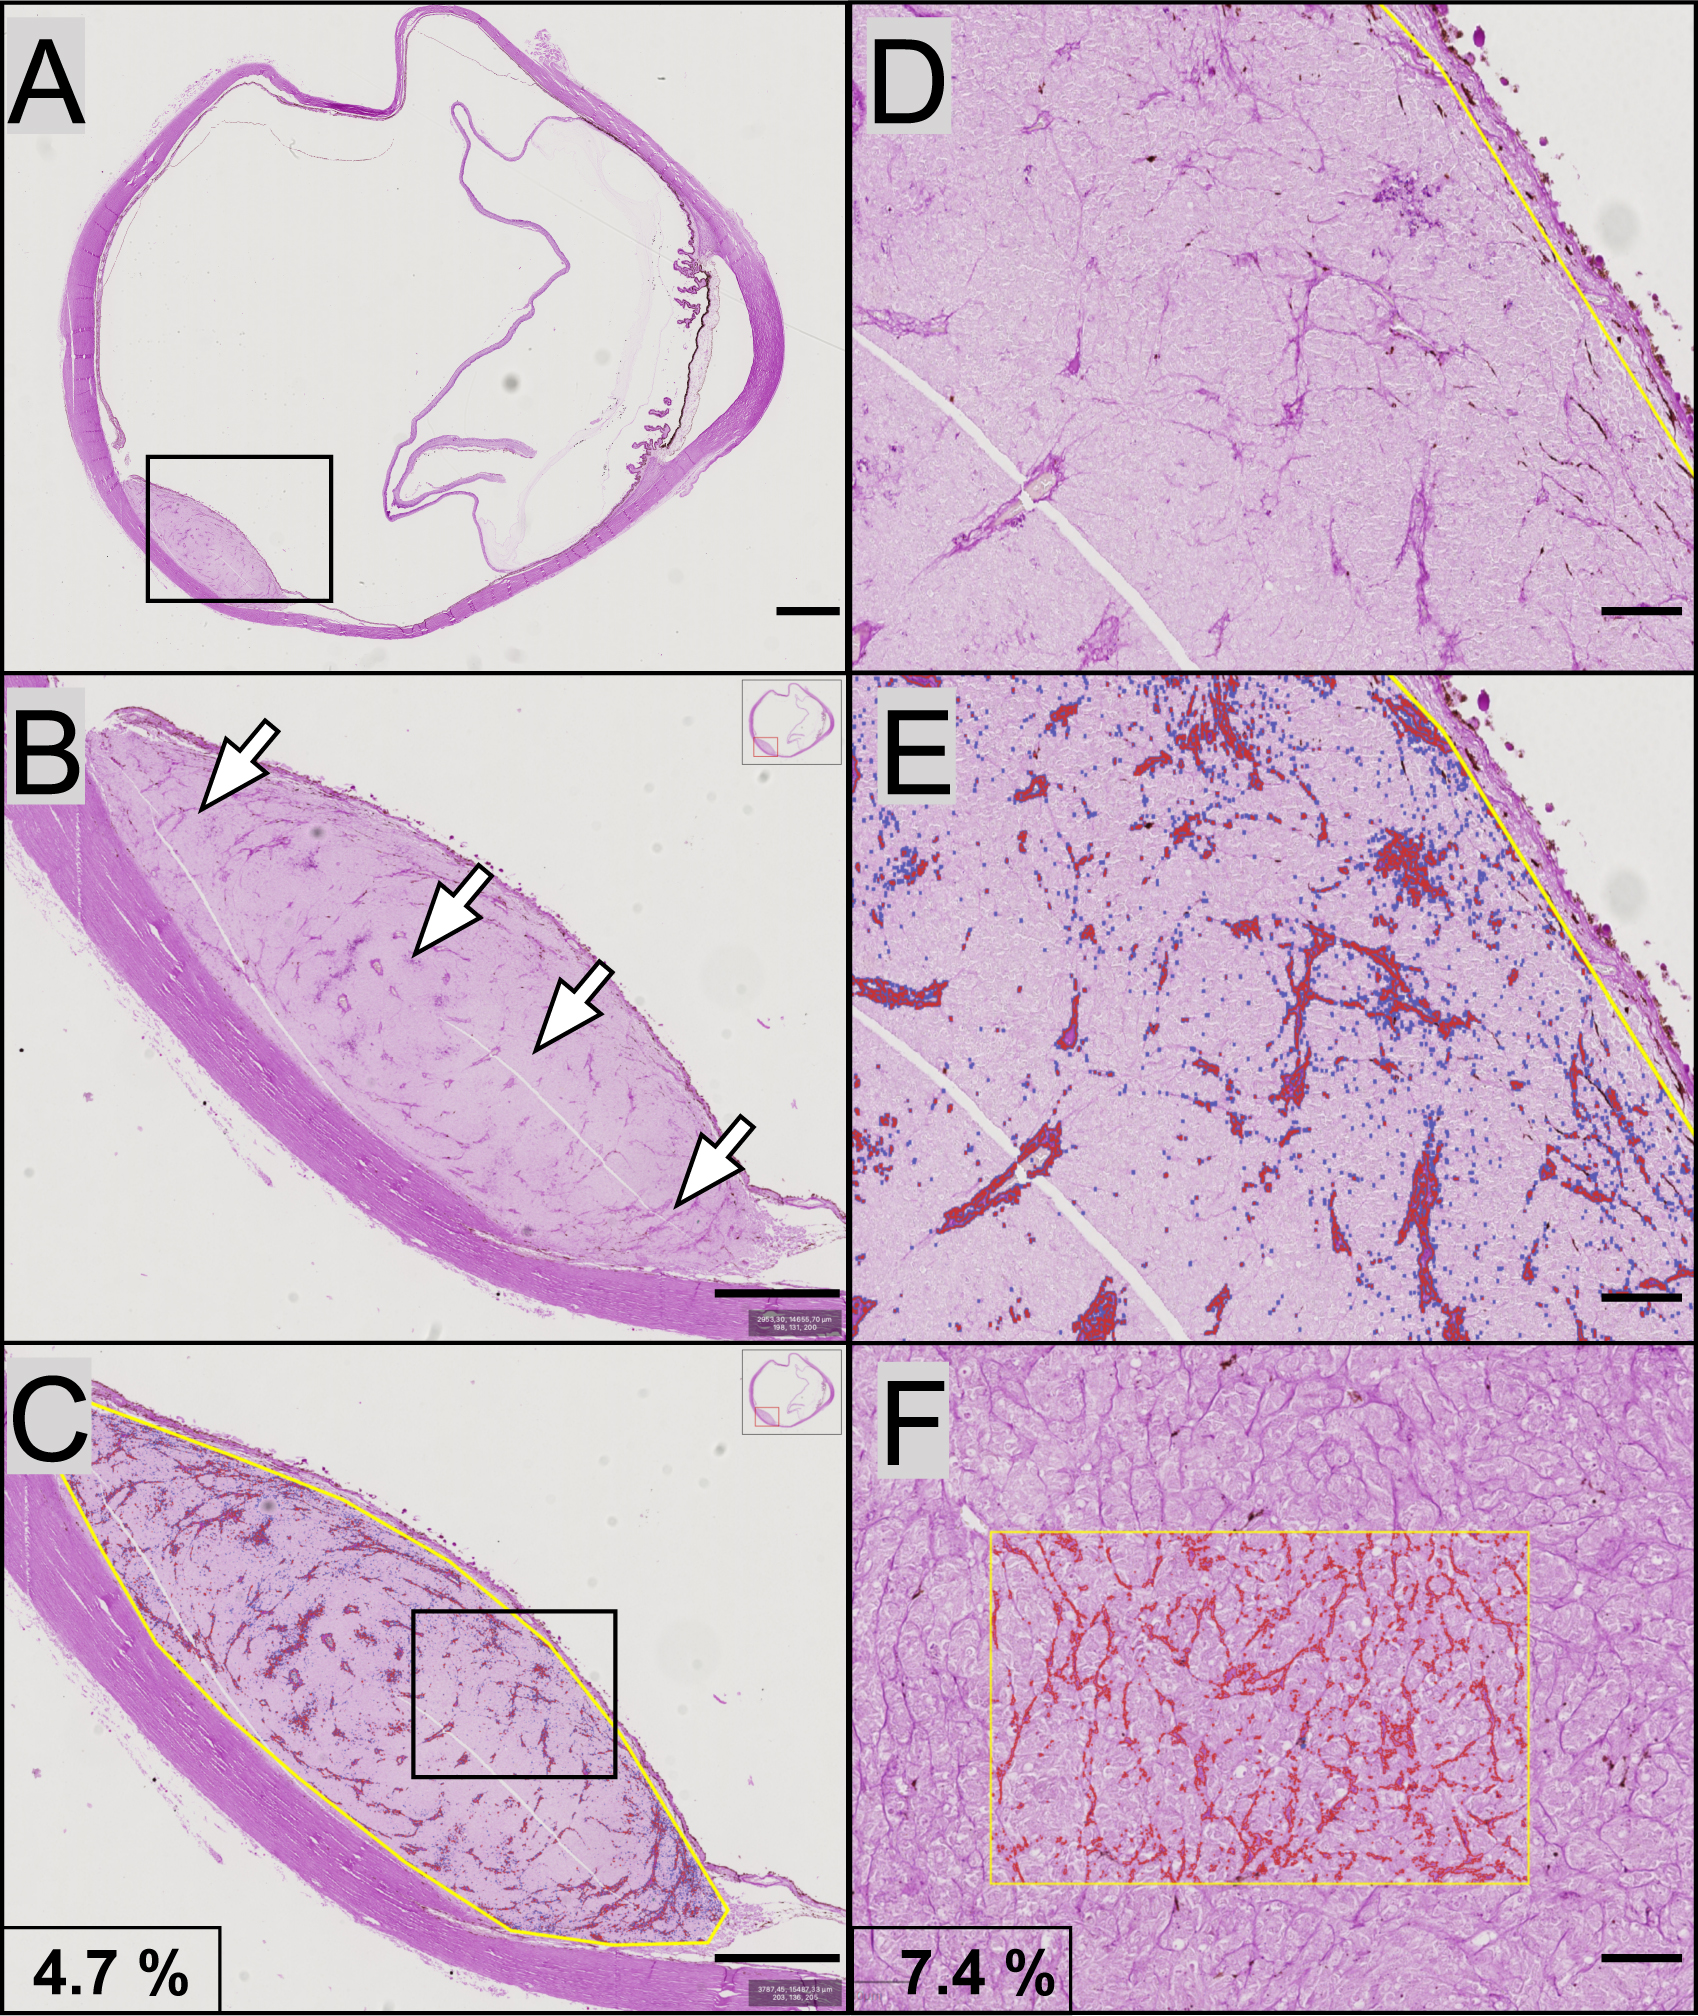
 Figure 1 of
Stålhammar, Mol Vis 2019; 25:502-516.
Figure 1 of
Stålhammar, Mol Vis 2019; 25:502-516.