Figure 3. Metabolic pathway analysis for patients with PCG. A: Metabolic pathway analysis of 38 significantly different metabolites among patients with PCG, CCs, and ARCs using the MetaboAnalyst
web server. B: Metabolic pathway analysis of 54 significantly different metabolites between patients with PCG and POAG by using the MetaboAnalyst
web server. PCG: primary congenital glaucoma; CCs: congenital cataracts; ARCs: aged-related cataracts; POAG: primary open
angle glaucoma. The color and size of each dot were associated with the -log (p) value and pathway impact value, respectively, where a small p value and high pathway impact value indicate the pathway is
greatly influenced.
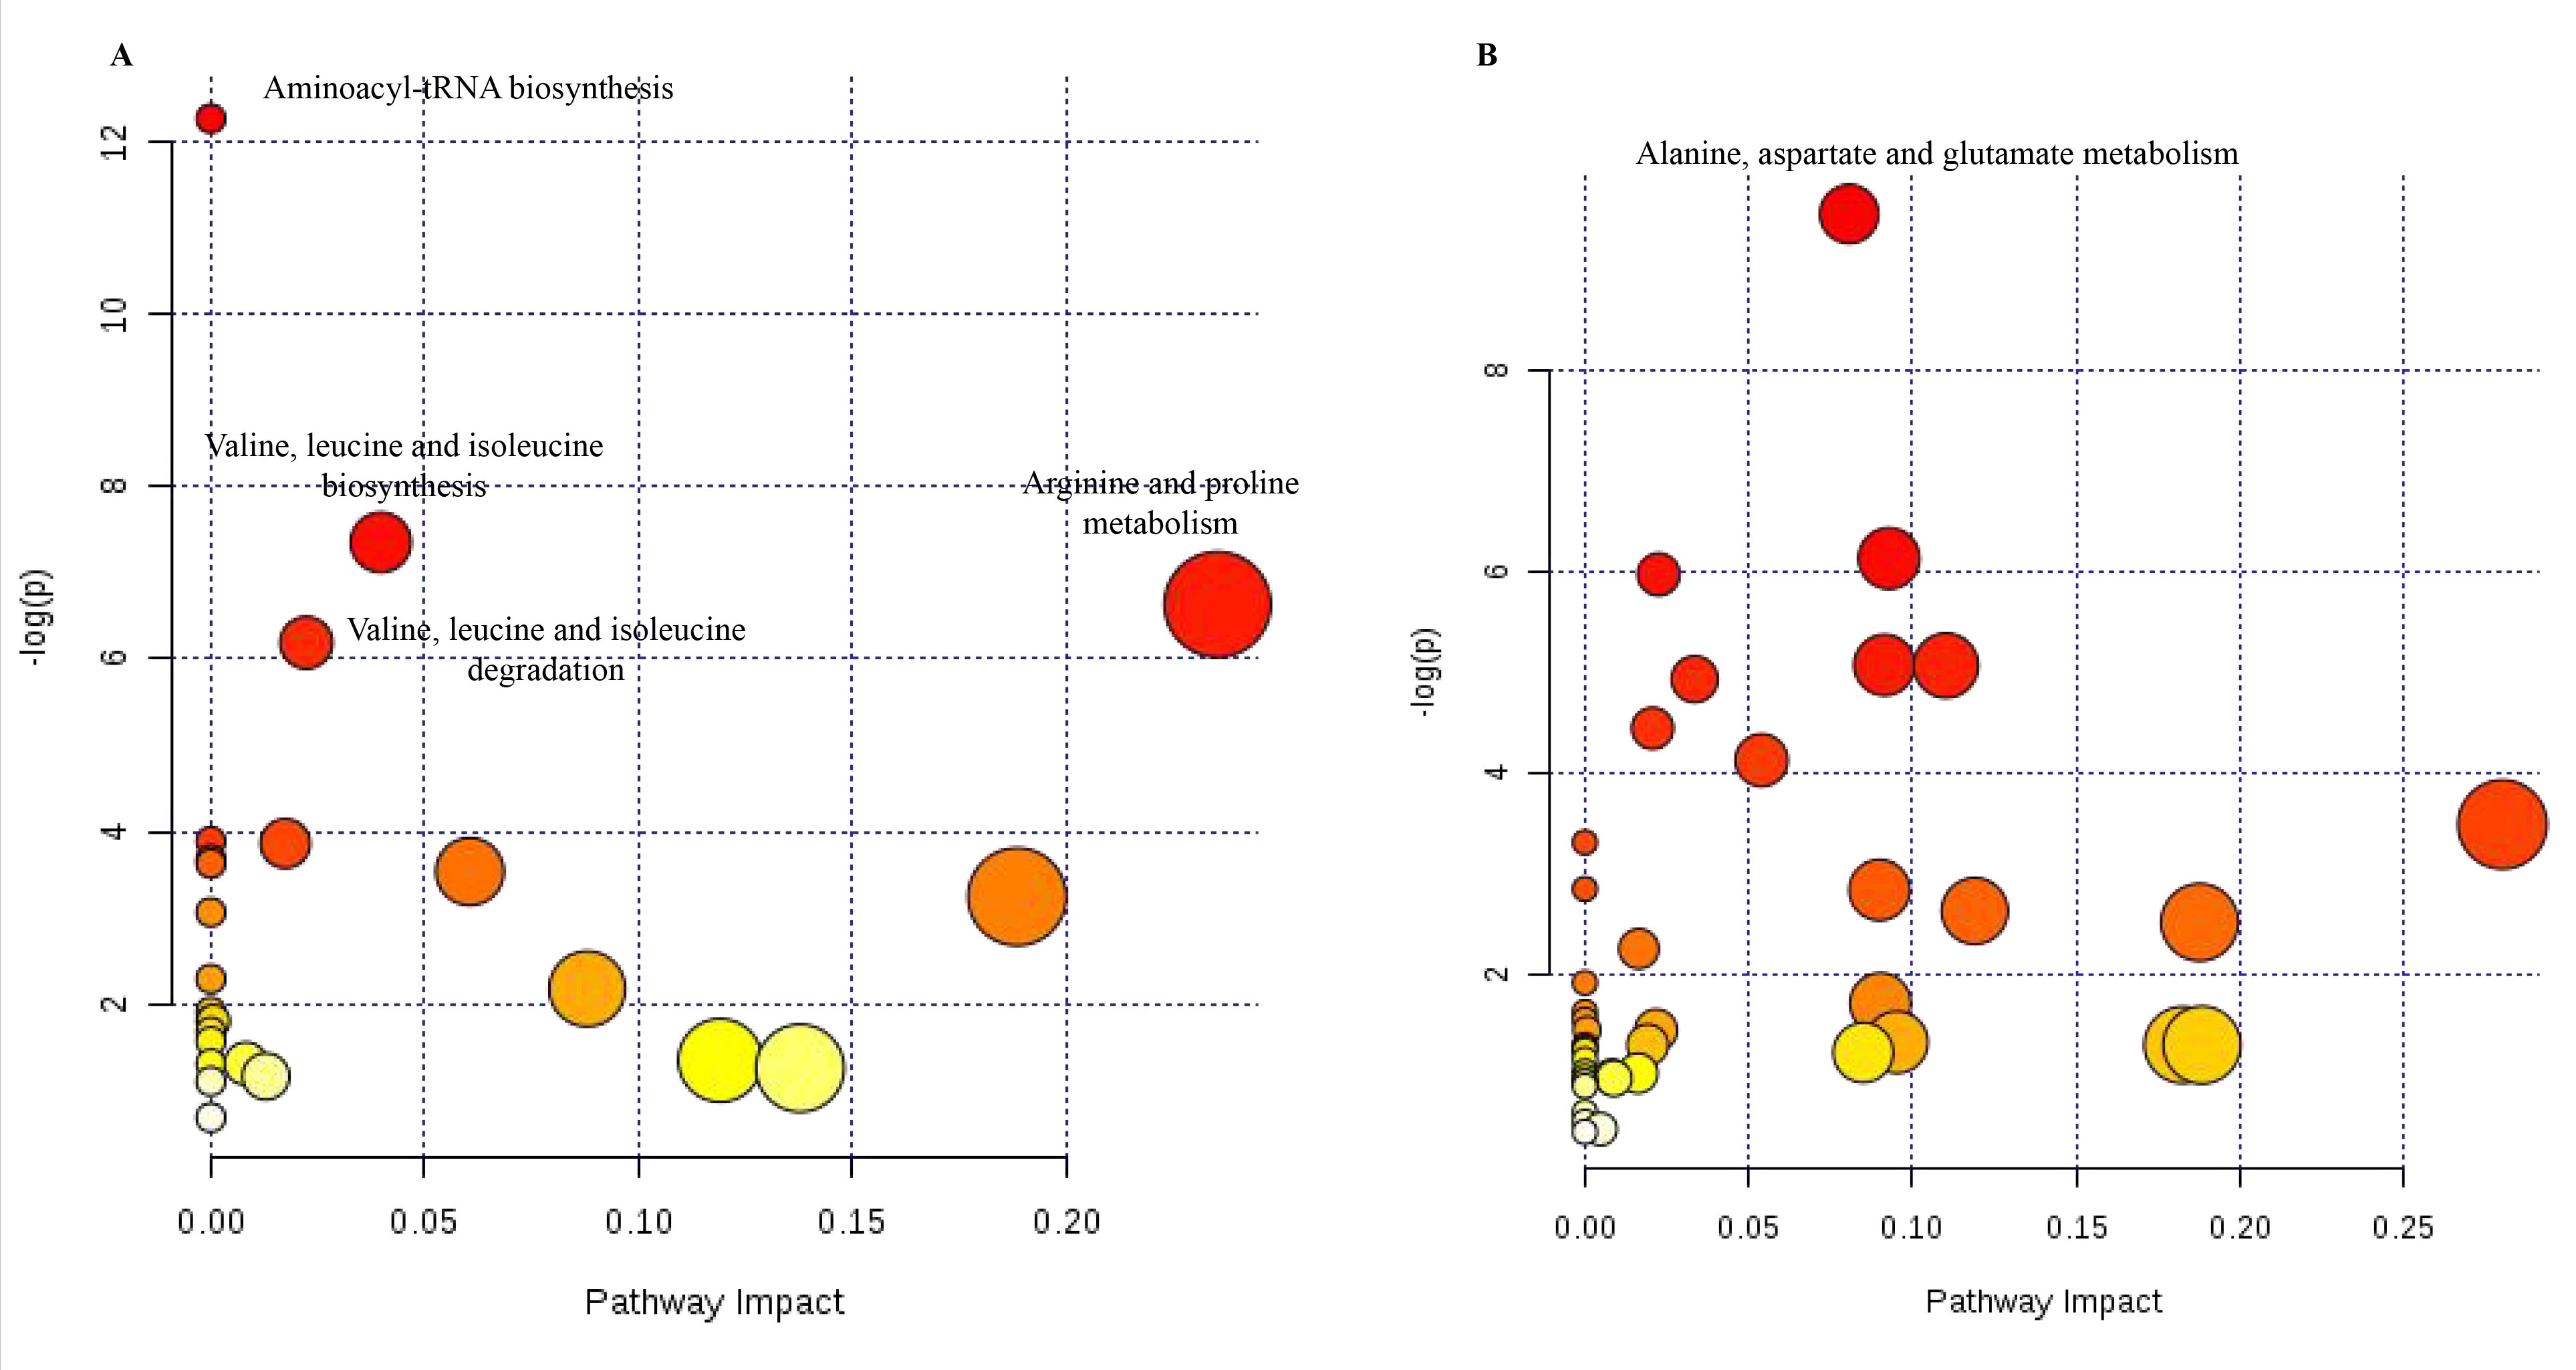
 Figure 3 of
Chen, Mol Vis 2019; 25:489-501.
Figure 3 of
Chen, Mol Vis 2019; 25:489-501.