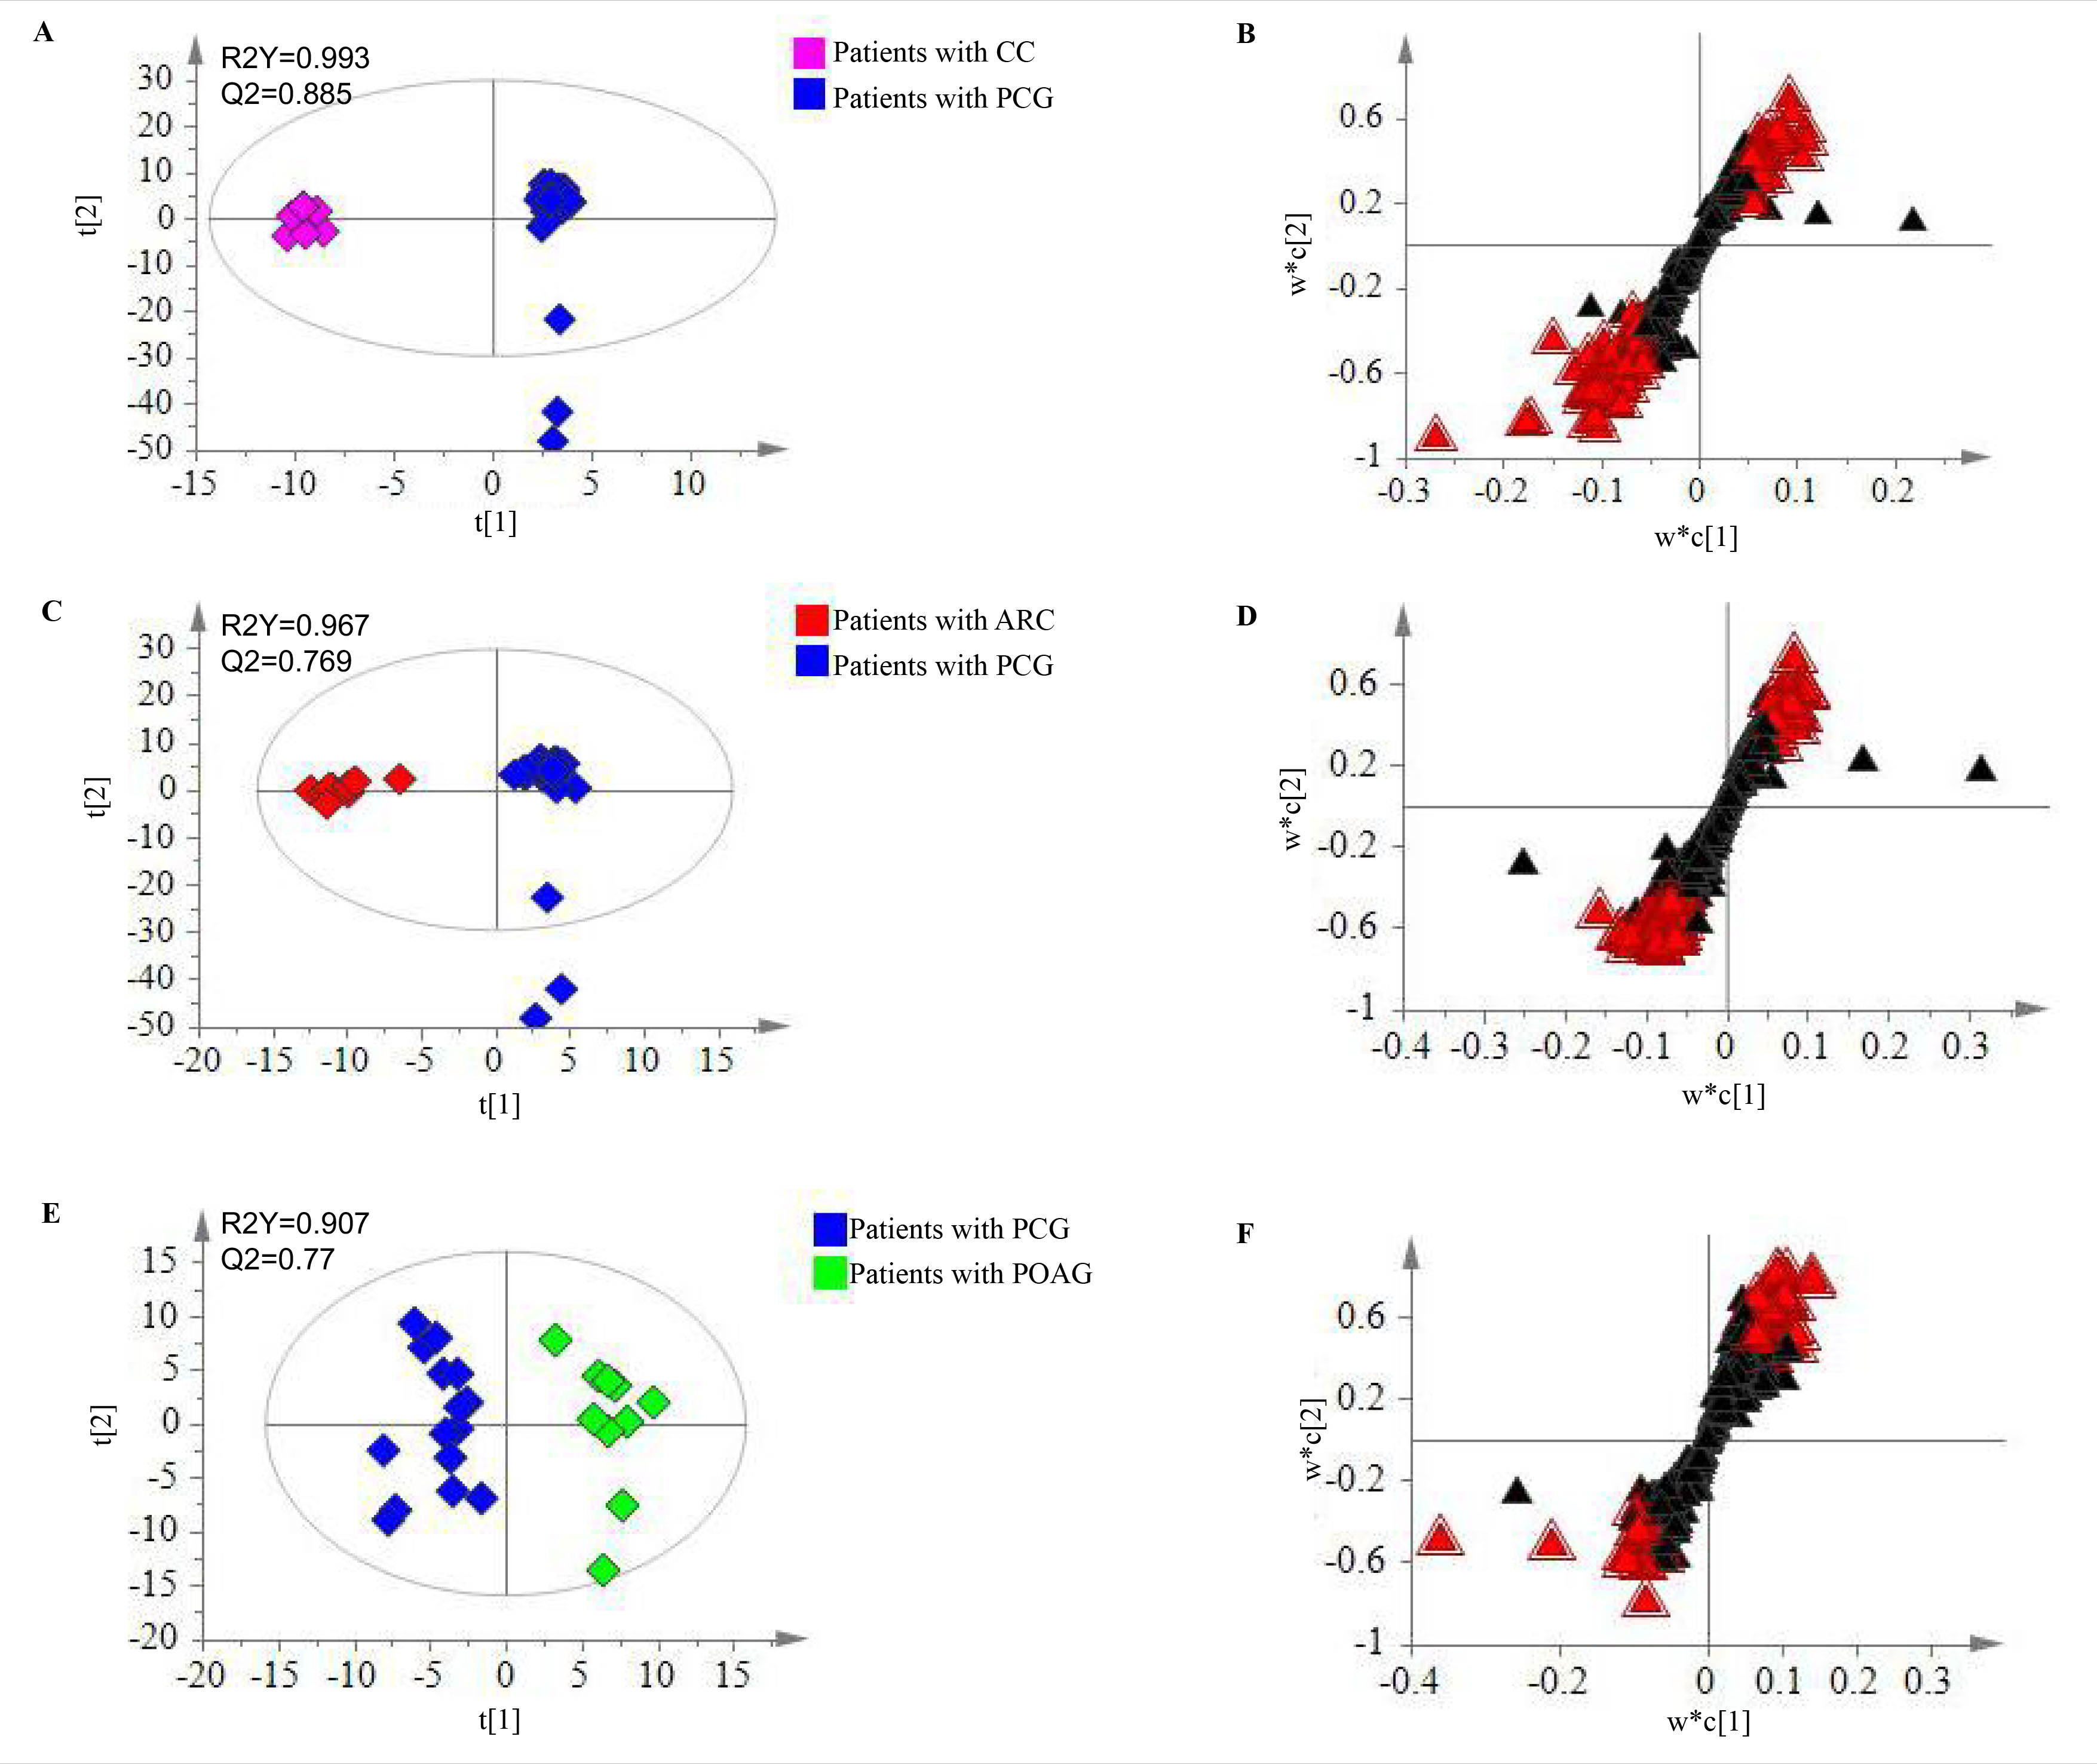
Figure 2. Metabolomic analysis for patients with PCG.
A: Score plot for the first two components (t[1] and t[2]) between patients with CCs and PCG in the PLS-DA model.
B: S plot for the two first components (w*c [
1] and w*c [
2]) between patients with CCs and PCG in the PLS-DA model.
C: Score plot for the first two components (t[1] and t[2]) between patients with ARCs and PCG in the PLS-DA model.
D: S plot for the two first components (w*c [
1] and w*c [
2]) patients with ARCs and PCG in the PLS-DA model.
E: Score plot for the first two components (t[1] and t[2]) between patients with PCG and POAG in the PLS-DA model.
F: S plot for the two first components (w*c [
1] and w*c [
2]) patients with PCG and POAG in the PLS-DA model. Significantly changed metabolites were labeled with a red triangle. PCG:
primary congenital glaucoma; CCs: congenital cataracts; ARCs: aged-related cataracts; POAG: primary open angle glaucoma.
 Figure 2 of
Chen, Mol Vis 2019; 25:489-501.
Figure 2 of
Chen, Mol Vis 2019; 25:489-501.