Figure 1. Metabolomics analysis of 50 AH samples, including 30 patients with PCG, 10 patients with CCs, and 10 patients with ARCs. A: Heat map of 363 metabolites detected in 50 AH samples by a hierarchical cluster analysis. Each line represents one metabolite.
The darker the green color, the lower its content in the sample; likewise, the darker the red color, the higher its content
in the sample. XB represents patients with CCs, and LB represents patients with ARCs, while C represents patients with PCG.
B: 3D score plot for the first three components (t[1], t[2], and t[3]) in the PCA model of metabolomics data from 50 AH samples.
PCG: primary congenital glaucoma; CCs: congenital cataracts; ARCs: aged-related cataracts.
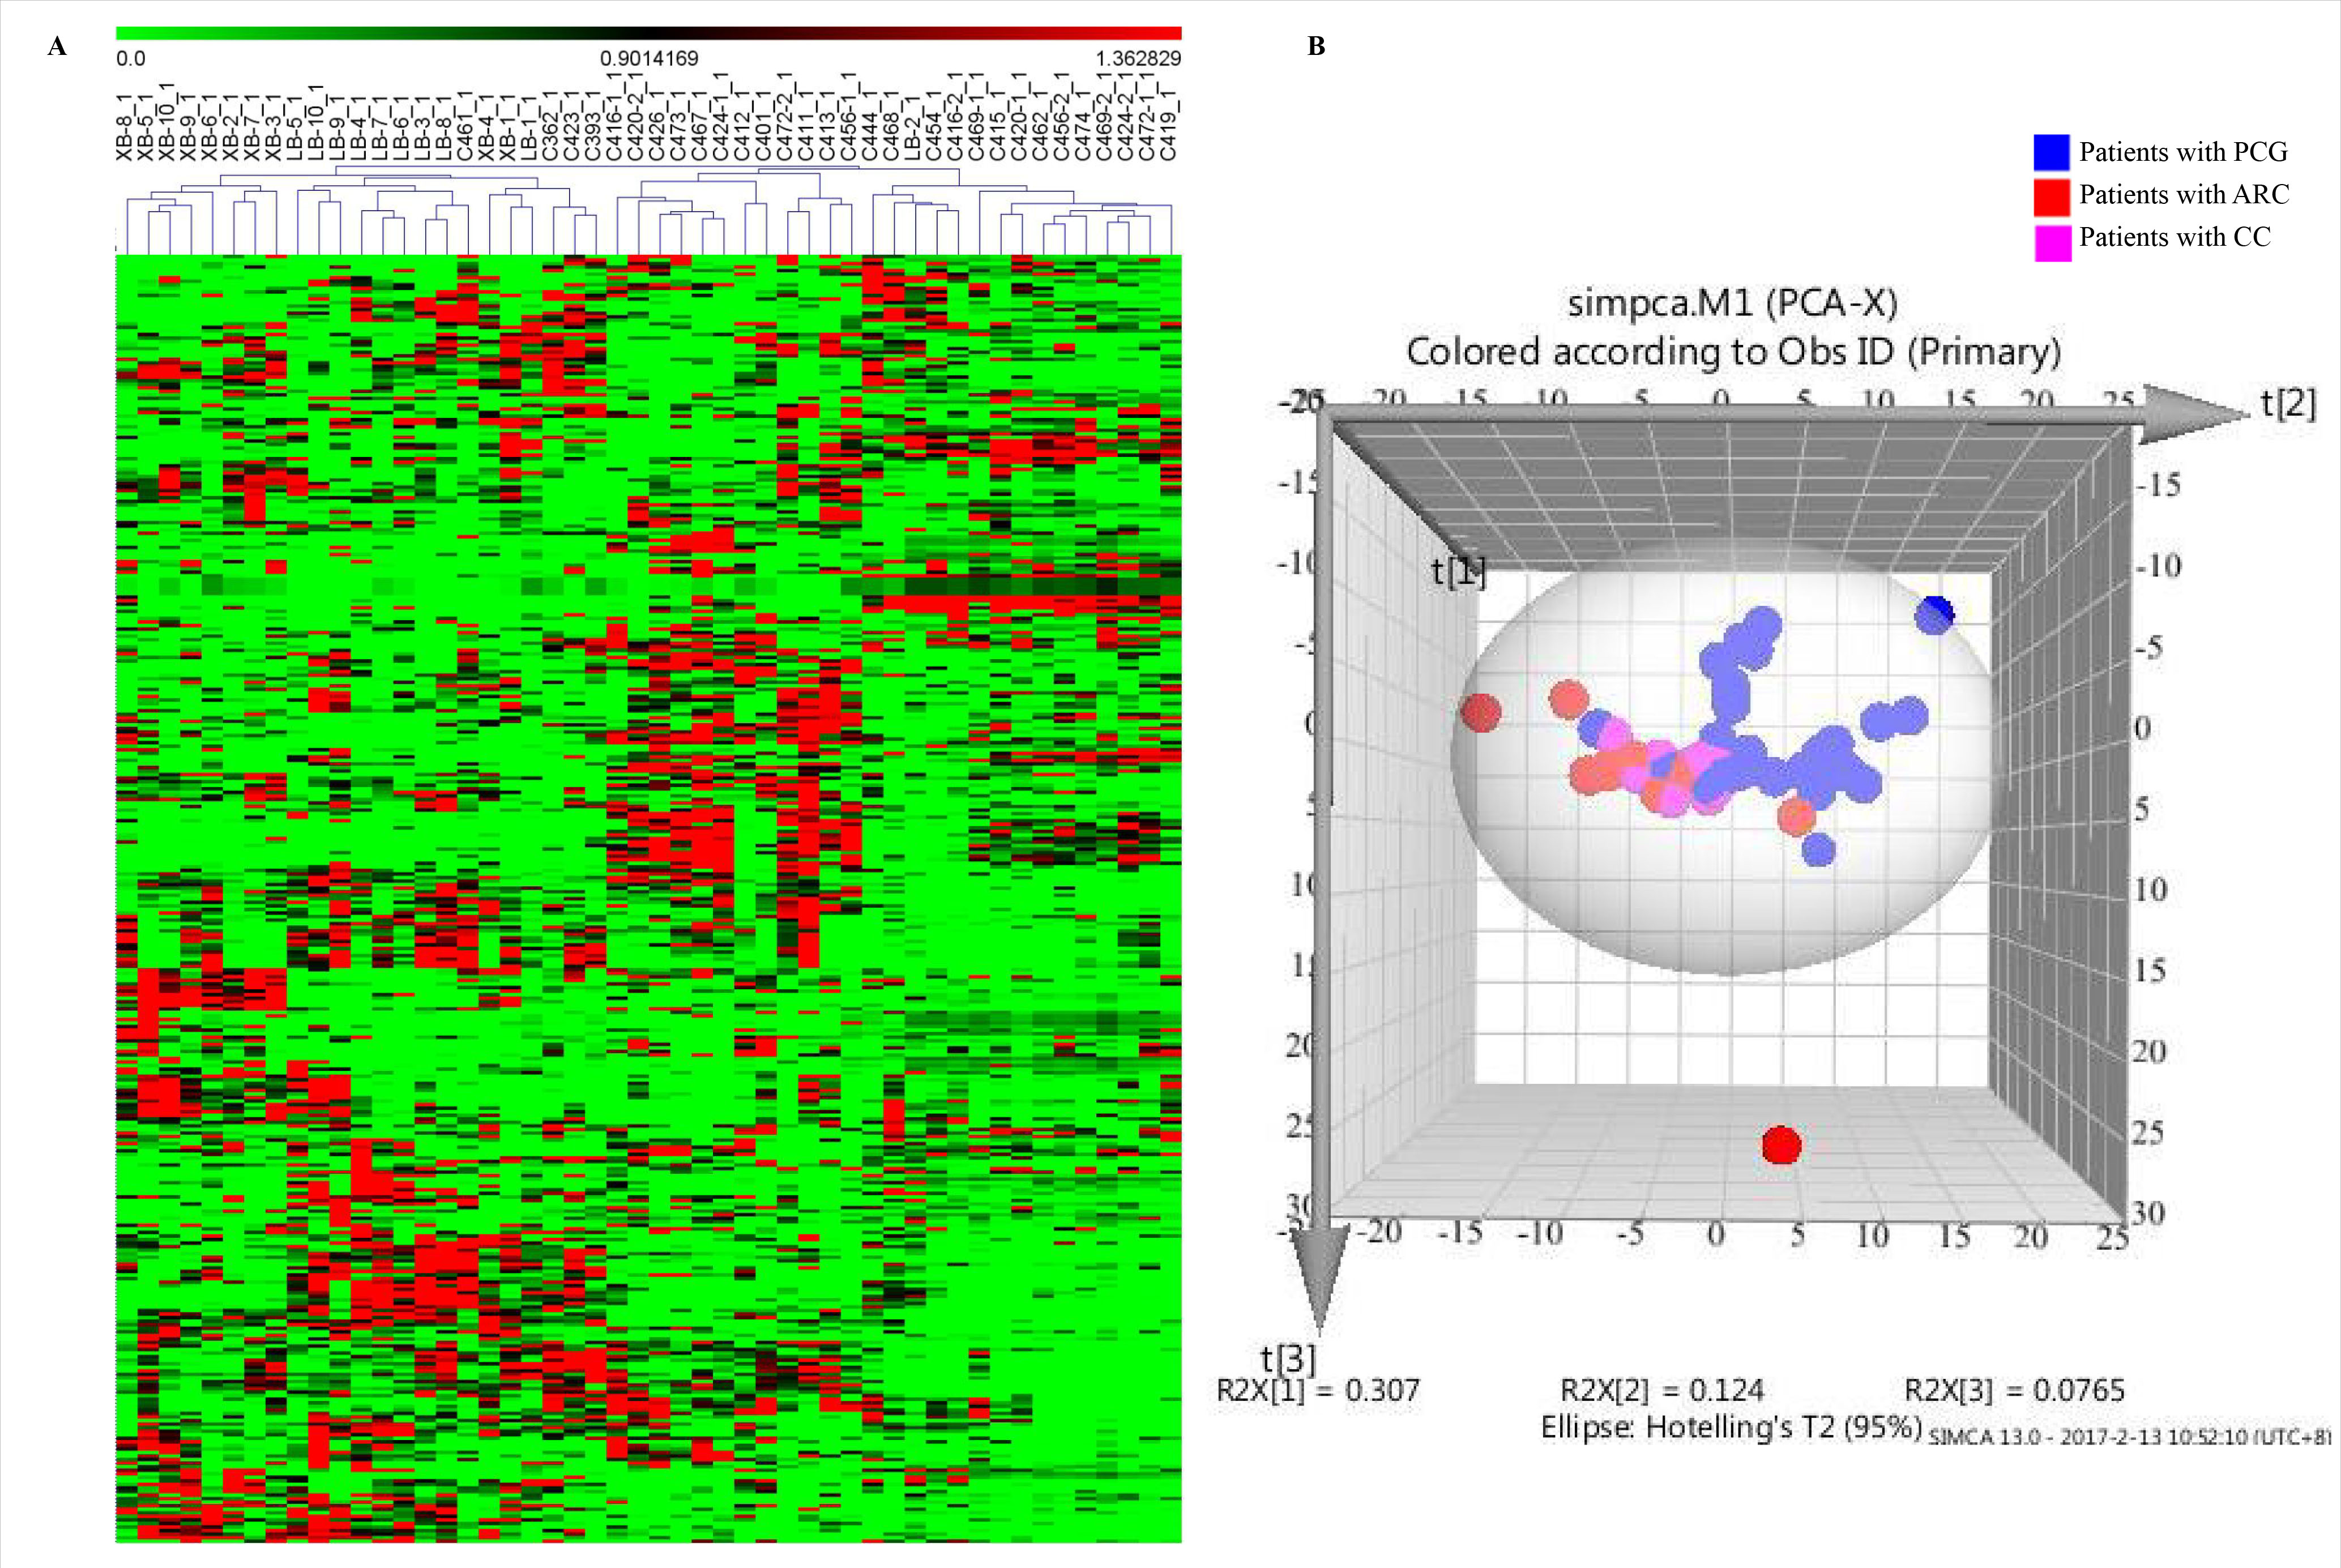
 Figure 1 of
Chen, Mol Vis 2019; 25:489-501.
Figure 1 of
Chen, Mol Vis 2019; 25:489-501.