Figure 4. Gene expression profile of selected markers in glucose oxidase-hydrogen peroxide (GO-H2O2) –induced stress treated ARPE-19 cells that were subjected to a 2 h pretreatment with samples (M and F2). M (40 µg/ml) and
F2 (200 µg/ml) represent myricetin or myricetin derivative–rich fraction, respectively. The concentration of glucose oxidase
(GO) used is 12 mUnit/ml. Quantitative real-time reverse transcriptase-PCR was performed using a custom RT2 profiler PCR array. y-axis represents the n-fold of regulation (mean ± standard deviation (SD) of two separate experiments)
against control (untreated cells grown in basal media) after normalization with human 18SrRNA, the endogenous control. The
dotted line represents the fold regulation of the untreated control (1.00). The paired t test between the GO-treated cells and control showed statistical significance at #p<0.05, ##p<0.01, and ###p<0.001, respectively. The one-way ANOVA Tukey’s post hoc test showed statistical significance at *p<0.05, ** p<0.01, and
*** p<0.001 when the test samples (M and F2) were compared to the GO-treated cells only.
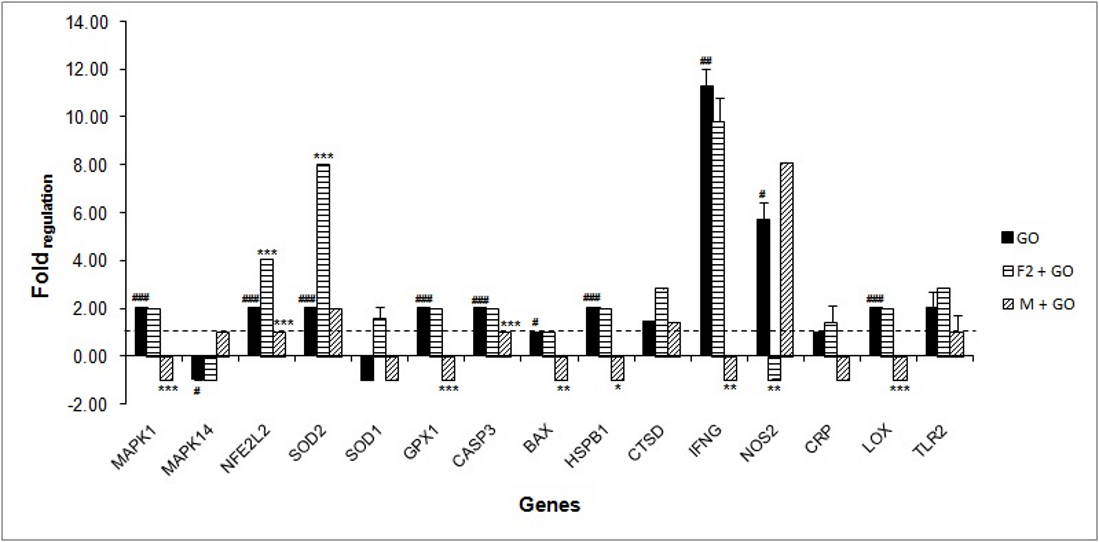
 Figure 4 of
Arumugam, Mol Vis 2019; 25:47-59.
Figure 4 of
Arumugam, Mol Vis 2019; 25:47-59.