Figure 6. Exercise suppresses subretinal autofluorescence observed in the I307N Rho retinal degeneration. A–C: Representative morphology images from each group at the level of the photoreceptor–RPE interface. In vivo Spectralis HRA+OCT
images (with blue autofluorescence detection) were taken 1 week after degeneration was induced. The top of each image is dorsal
or superior, and the bottom is ventral periphery or inferior. In the mice induced to degenerate, autofluorescent white spots
are numerous and widespread (B and C), though generally less dense in the inferior hemisphere in the exercised mice (C). D: Autofluorescent white spots were counted across the entire captured field of the fundus. None were detected in the uninduced
mice. Active mice undergoing induced degeneration (green bar) exhibited statistically significantly fewer white spots compared
to the inactive group (red bar). **p<0.005 by the Student t test. n=5–7 mice/group. Error bars are standard error of the mean (SEM). Size marker represents 200 µm.
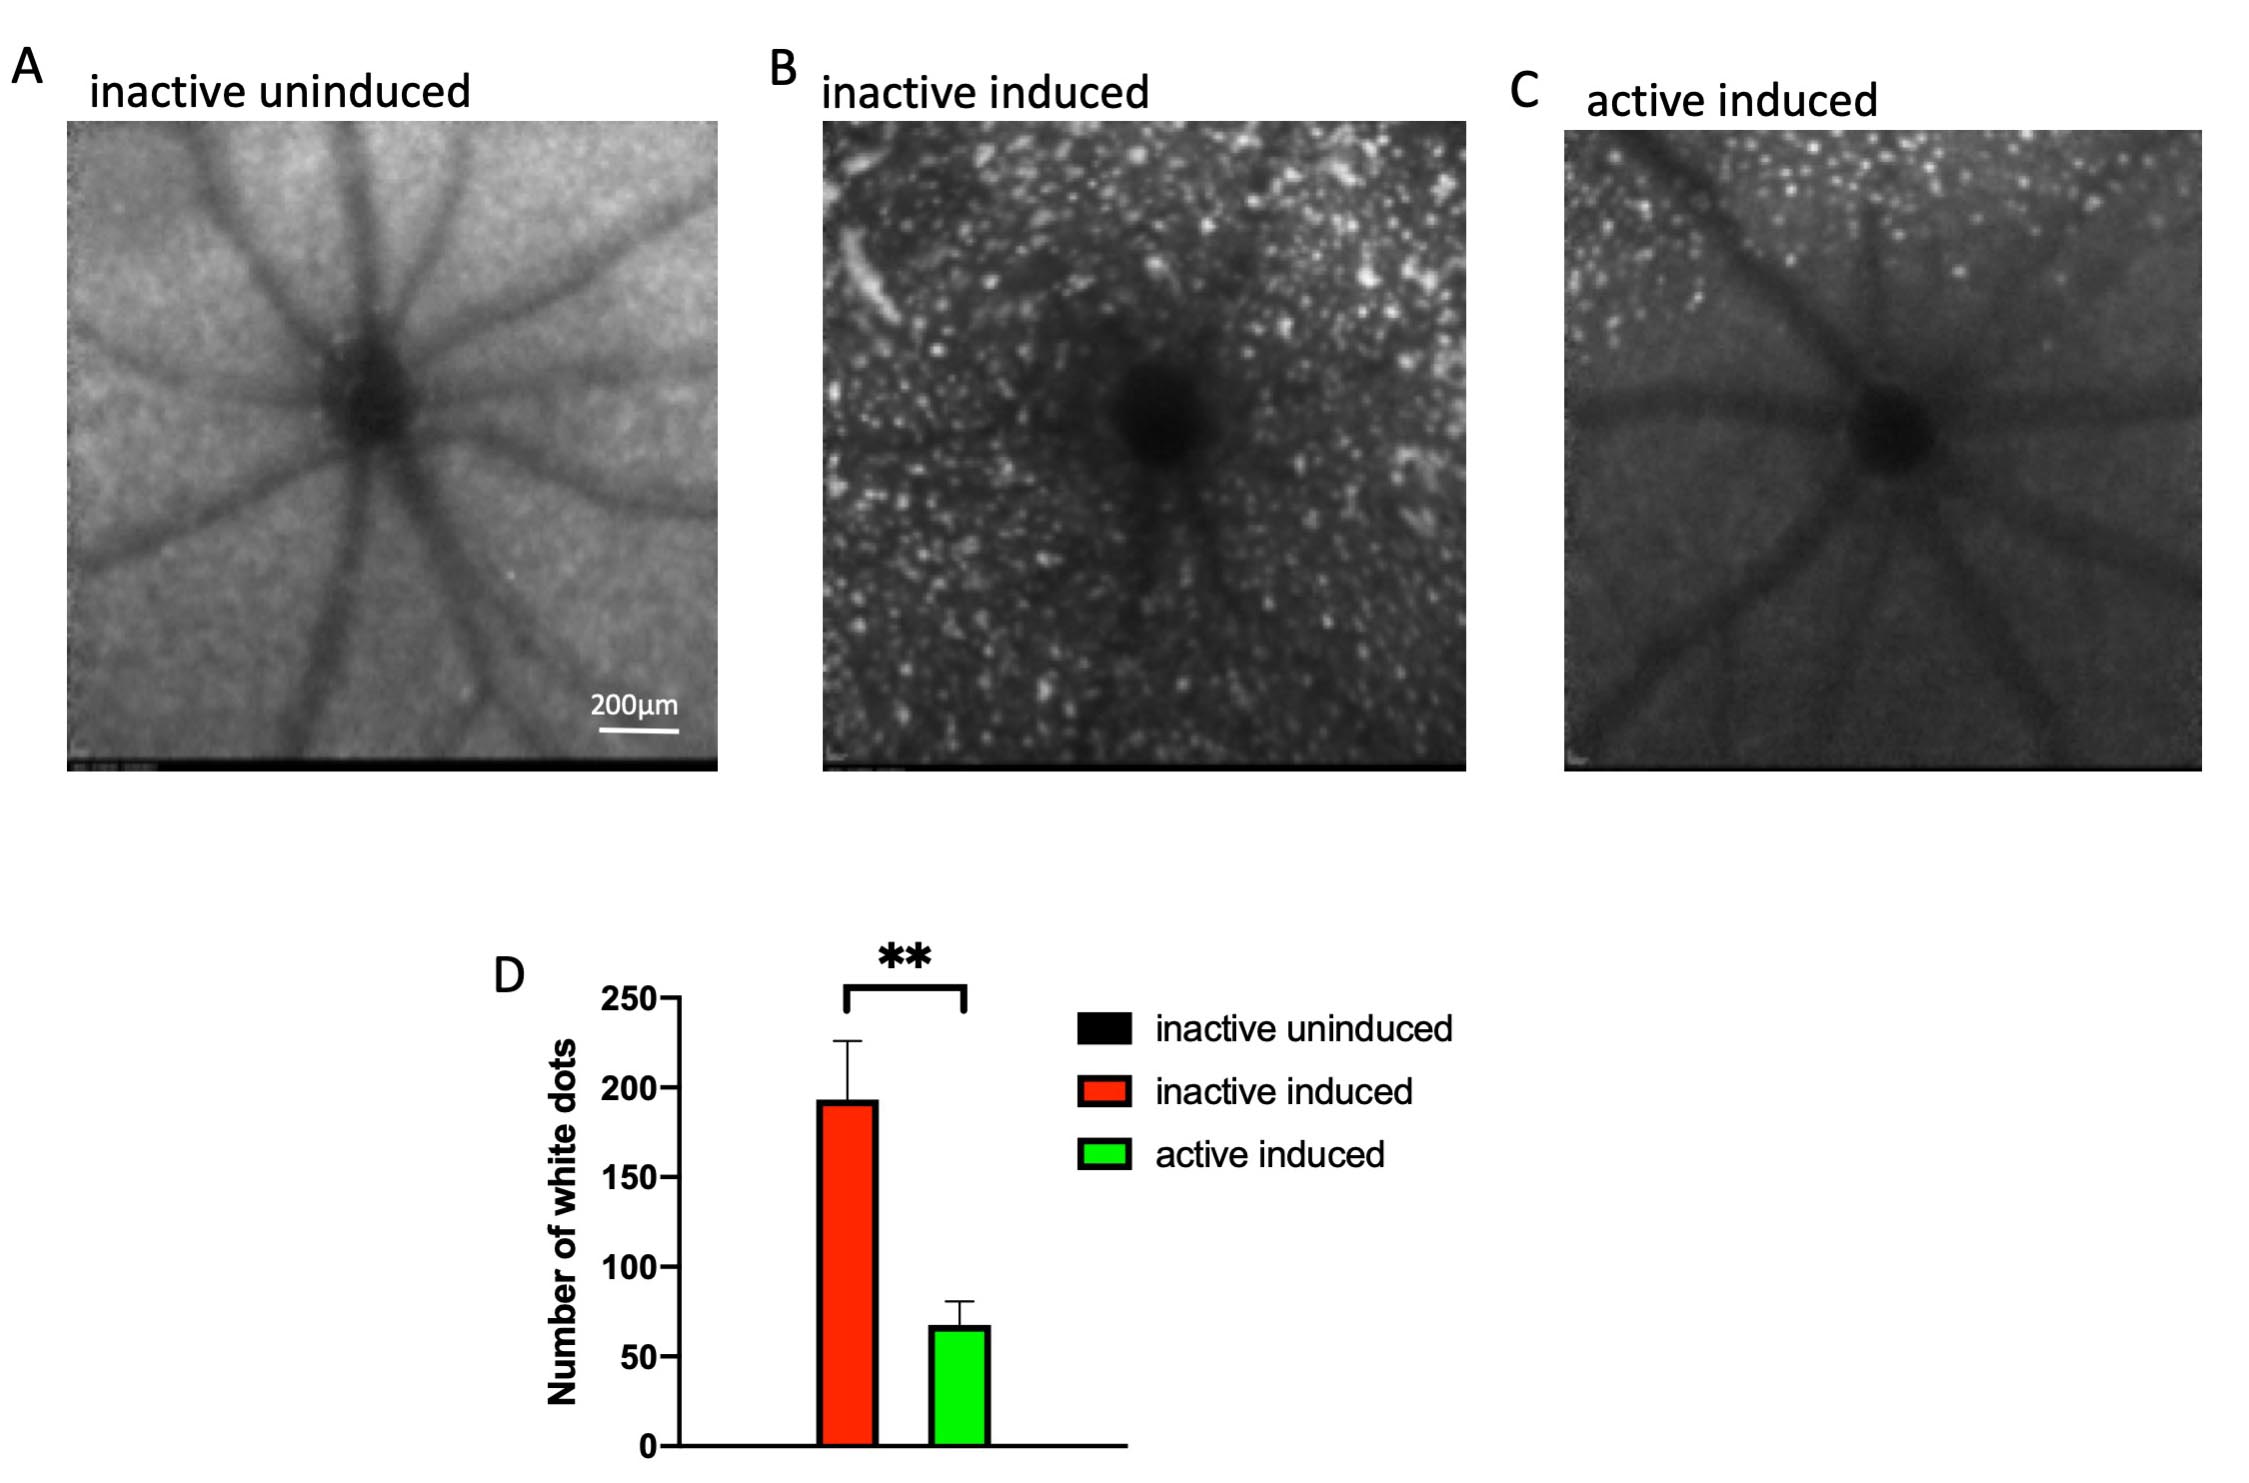
 Figure 6 of
Zhang, Mol Vis 2019; 25:462-476.
Figure 6 of
Zhang, Mol Vis 2019; 25:462-476.