Figure 3. Interventional DMF treatment preserves visual acuity. A: Graph of the average number of days that mice on the interventional regimen registered an optokinetic tracking (OKT) reading
deficit of 10% (left graph), 20% (center graph), or 30% (right graph) below their respective individual baseline OKT readings
as a function of dimethyl fumarate (DMF; blue bar) or vehicle (red bar). B: Graph of the average lowest OKT readings for mice on the interventional treatment with DMF or vehicle. C: Graph of the average number of optic neuritis episodes for mice on the interventional regimen with DMF or vehicle. D: Graph of the average difference between the baseline and final OKT readings for mice on the interventional regimen. Statistics
for all graphs determined with the Mann–Whitney U test, an asterisk denotes statistical significance, “ns” denotes not significant,
and error bars represent standard error of the mean (SEM); n=8 mice for each treatment group.
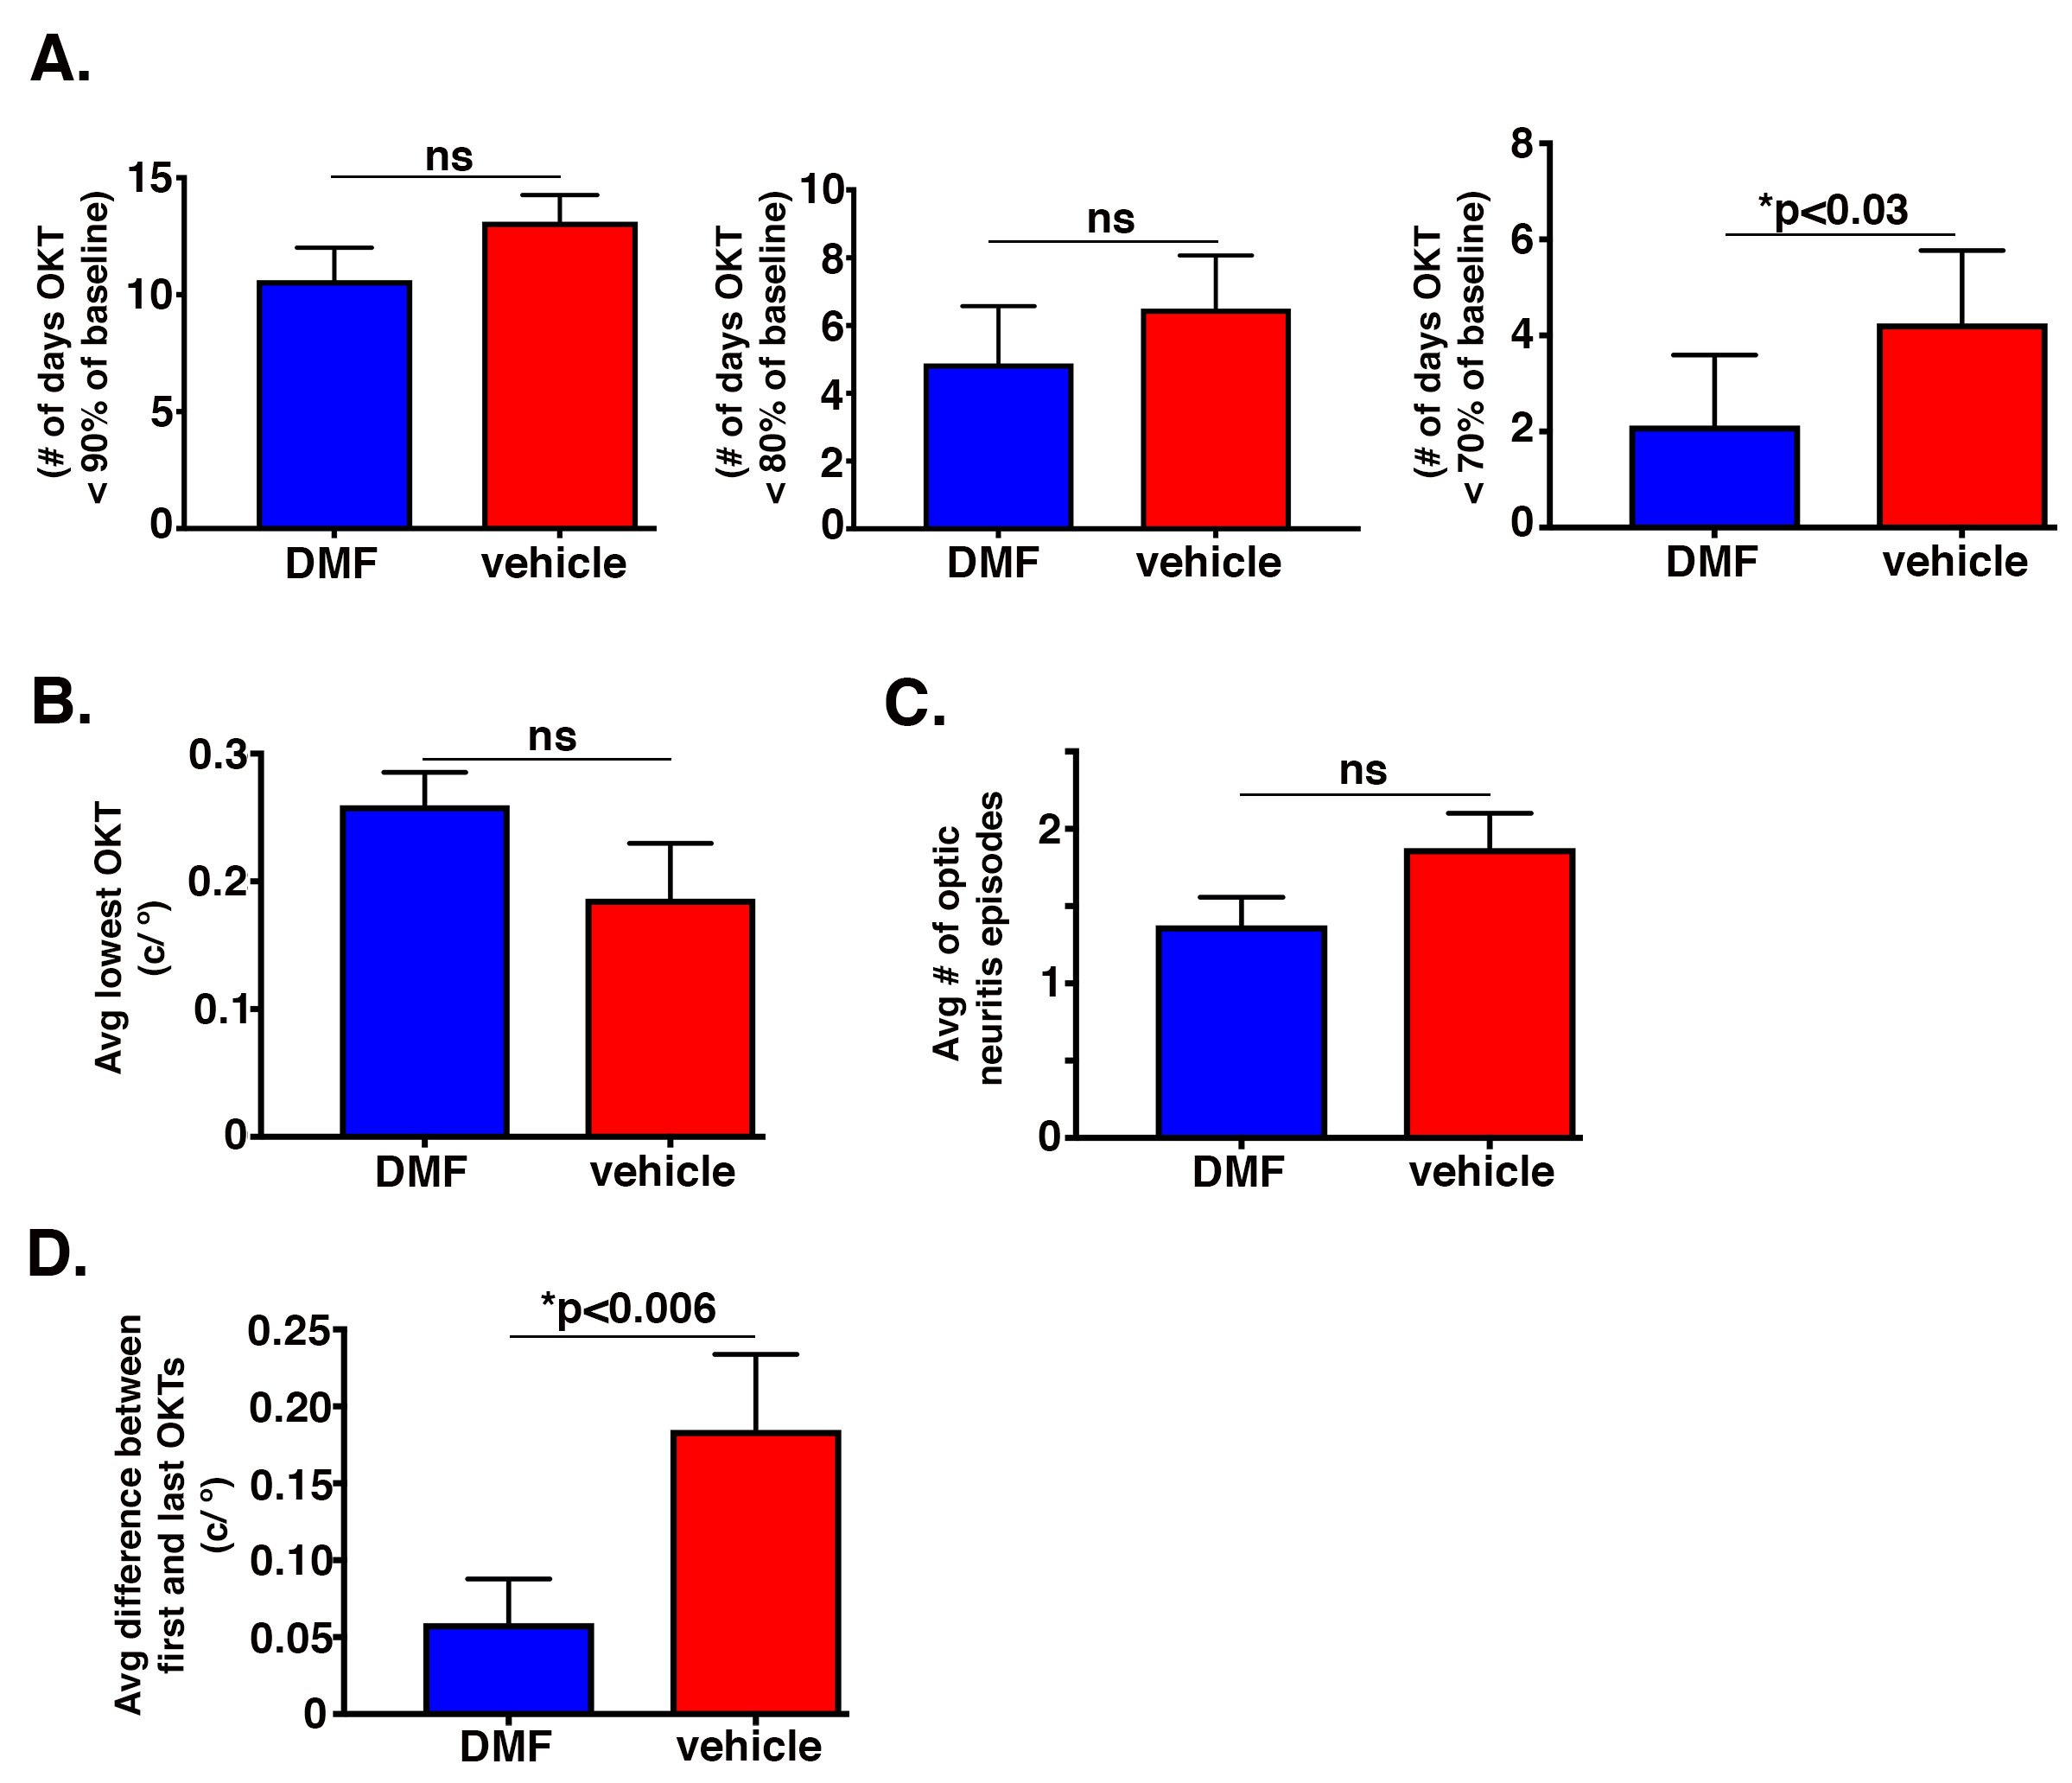
 Figure 3 of
Zyla, Mol Vis 2019; 25:446-461.
Figure 3 of
Zyla, Mol Vis 2019; 25:446-461.