Figure 2. DMF treatment mitigates EAE-induced motor and visual deficits. A, B:Comparison of motor scores between dimethyl fumarate (DMF; blue) and methylcellulose (vehicle; red) in a prevention regimen
(A) versus an interventional regimen (B). Motor scores were recorded daily, and are graphed as mean scores versus days post-immunization with the myelin oligodendrocyte
glycoprotein (residues 35–55; MOG35–55) peptide. C, D:Mean optokinetic tracking (OKT) visual acuity recordings in the more affected (MA) eyes of mice on the DMF prevention protocol
(C) or the interventional protocol (D) as a function of days post-immunization. Blue traces represent mean readings for DMF-treated mice, and red traces represent
mean readings for vehicle-treated animals. E, F: Same as C and D, but for the less affected (LA) eyes. For C–F, the gray trace on each graph depicts the difference between DMF and vehicle, such that the difference is statistically significant
when the lower value of the confidence bar is above the zero value on the axis of abscissa. OKT recordings were measured as
cycles per degree (c/°). For all graphs, “ns” indicates not statistically significant, and an asterisk and bracket indicate
a statistically significant (p<0.05) difference between DMF and vehicle for each time point under the bracket, as calculated
with the linear mixed effects model. Error bars represent the standard error of the mean (SEM). n=9 mice for each group in
the prevention regimen, and n=8 mice for each group in the interventional regimen.
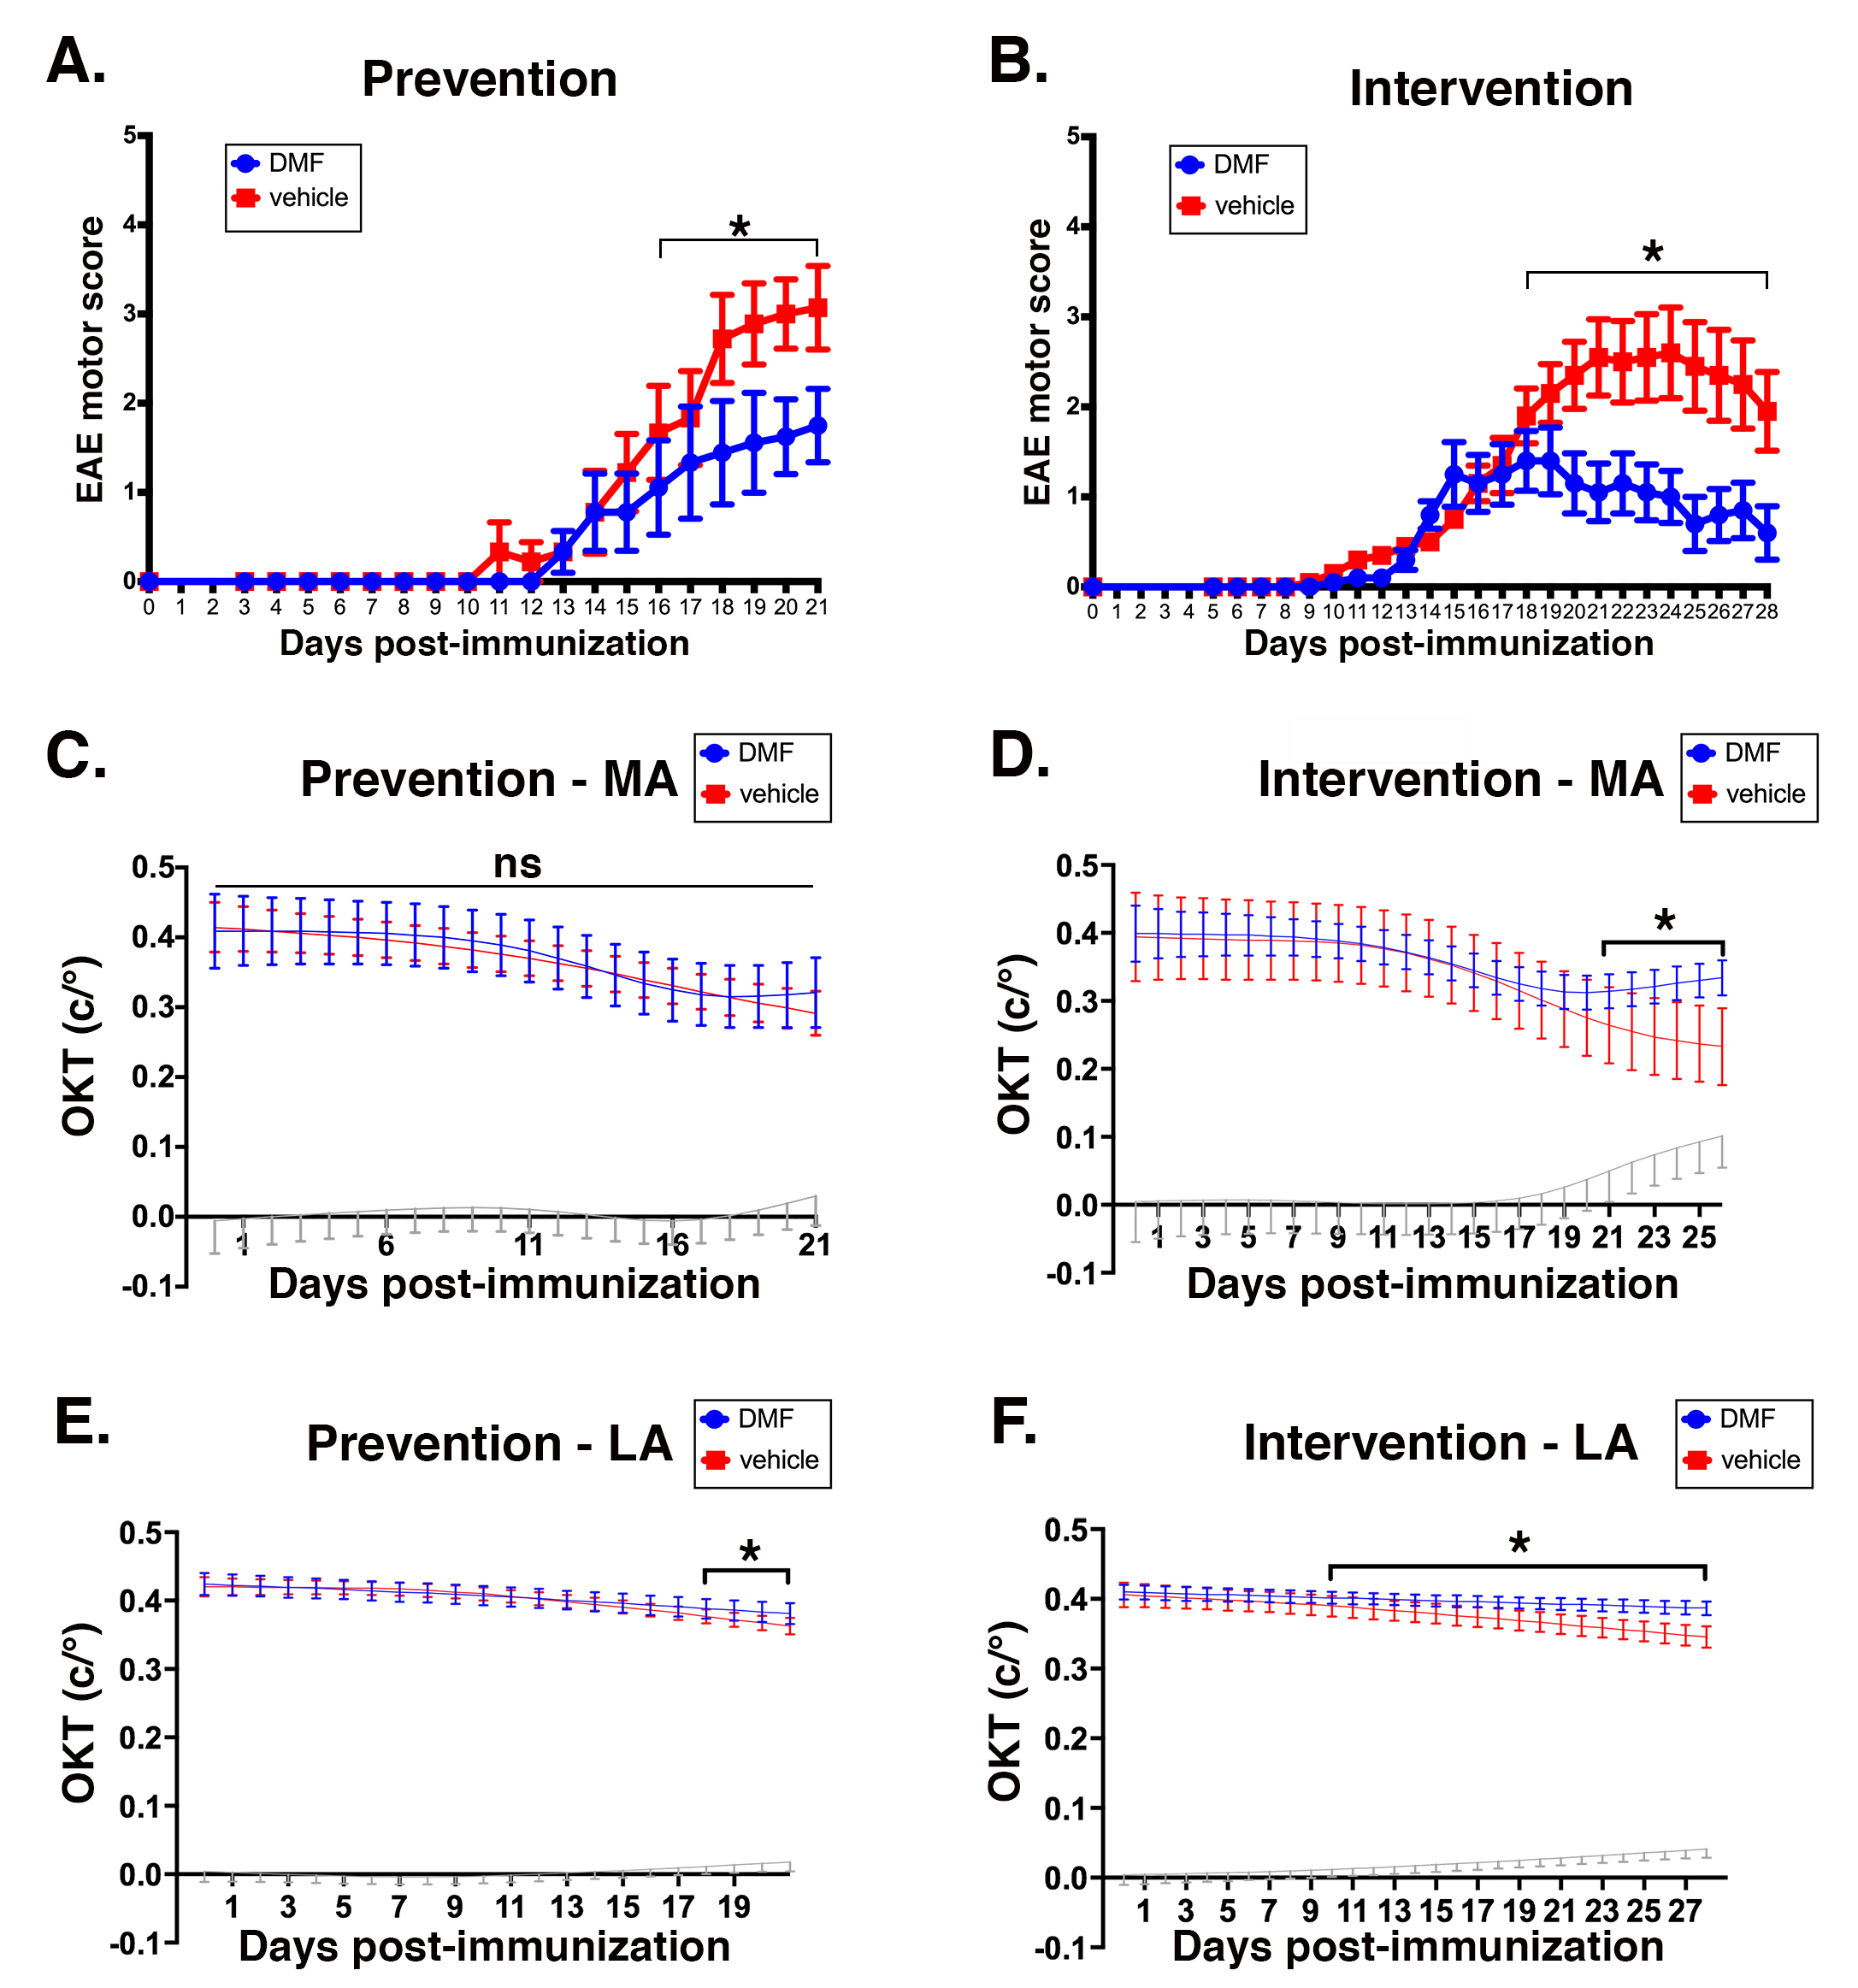
 Figure 2 of
Zyla, Mol Vis 2019; 25:446-461.
Figure 2 of
Zyla, Mol Vis 2019; 25:446-461.