Figure 2. Analysis of variance (ANOVA) analysis of serum free vitamin D levels in the three study groups. The y-axis gives the mean
log free vitamin D levels in each of the three study groups. The p value on the right of the figure was obtained from the
ANOVA test when comparing the three groups of subjects. On the top of the figure are p values for each pairwise comparison.
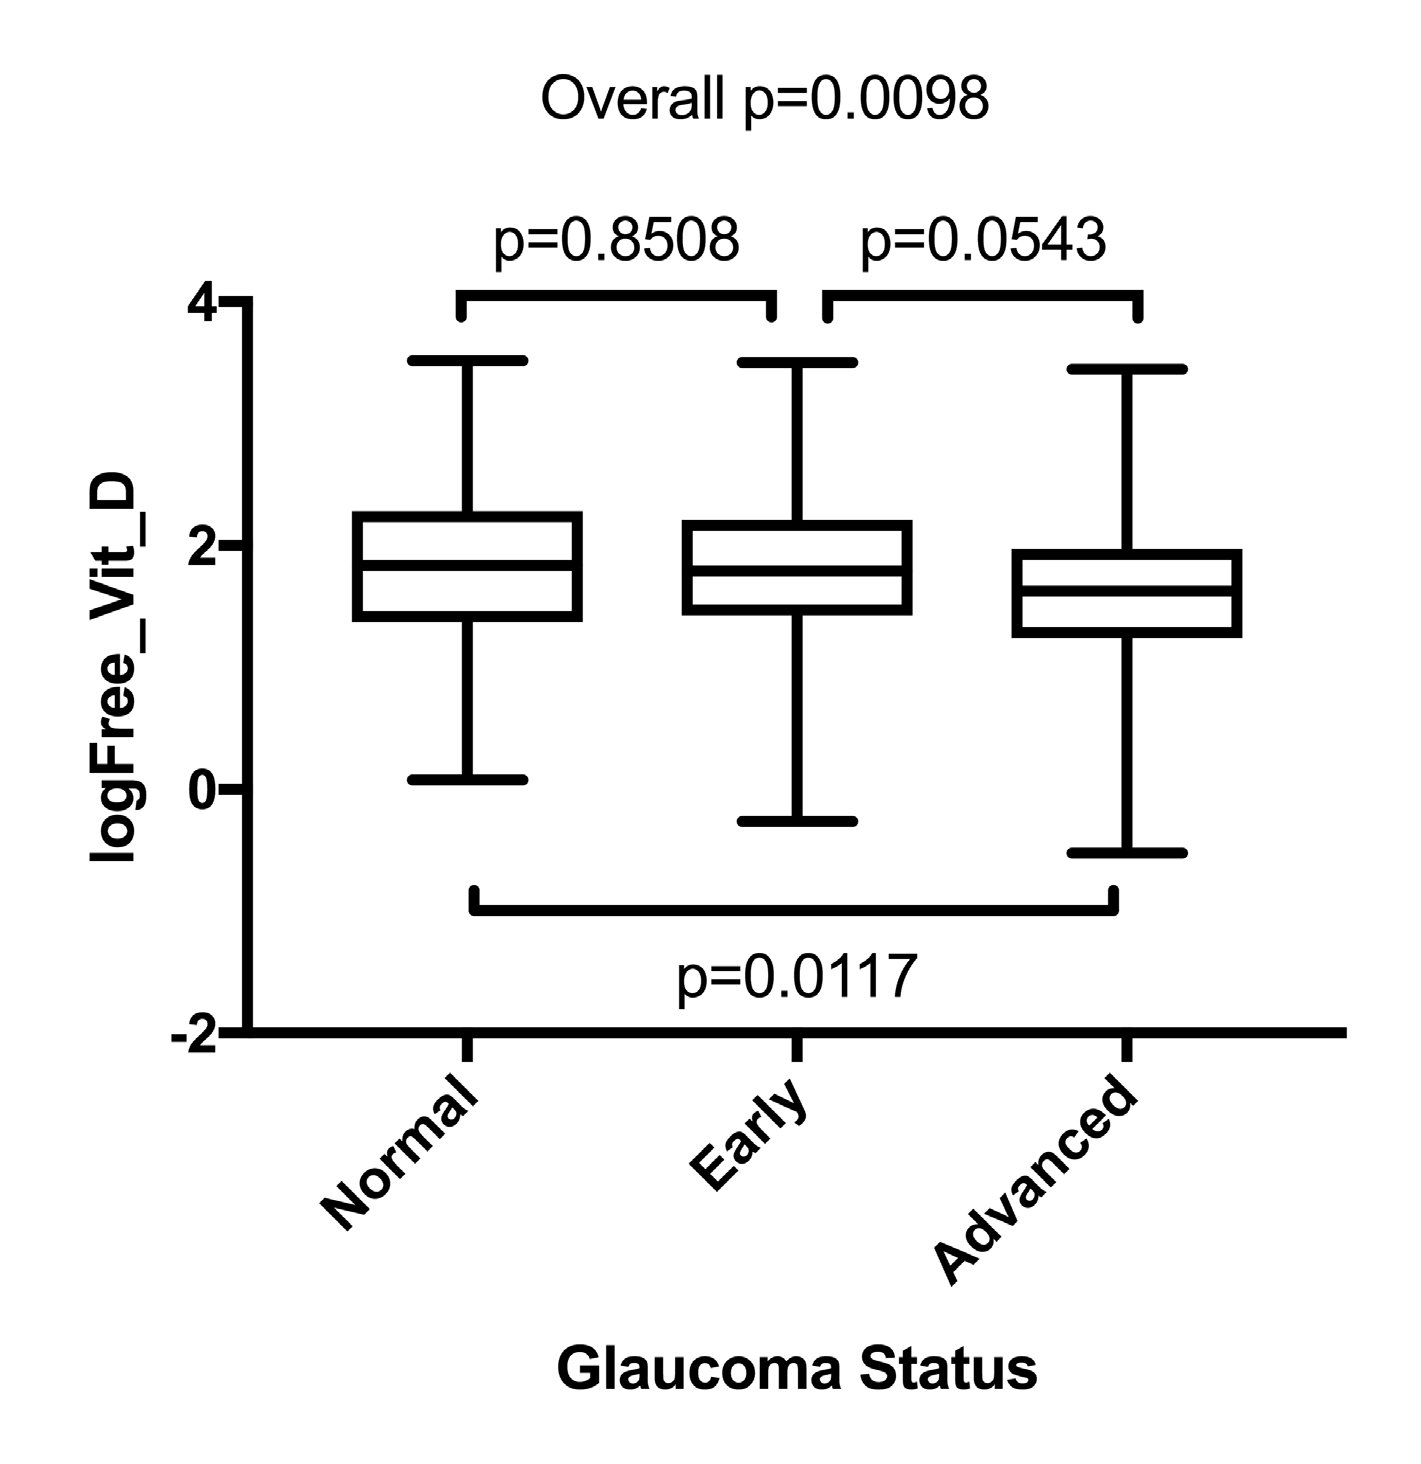
 Figure 2 of
Ayyagari, Mol Vis 2019; 25:438-445.
Figure 2 of
Ayyagari, Mol Vis 2019; 25:438-445.