Figure 3. The structural changes in the novel mutations. The molecular surface is colored according to the electrostatic potential with
Swiss-PdbViewer, with red-white-blue corresponding to acidic-neutral-basic potential. A: Surface change in CRYAA:p.R12L. B: Surface change in CRYBB2:Q155K. C: Surface change in CRYGD:p.F116Sfsx29. The yellow dotted circle represents the region of significant alteration.
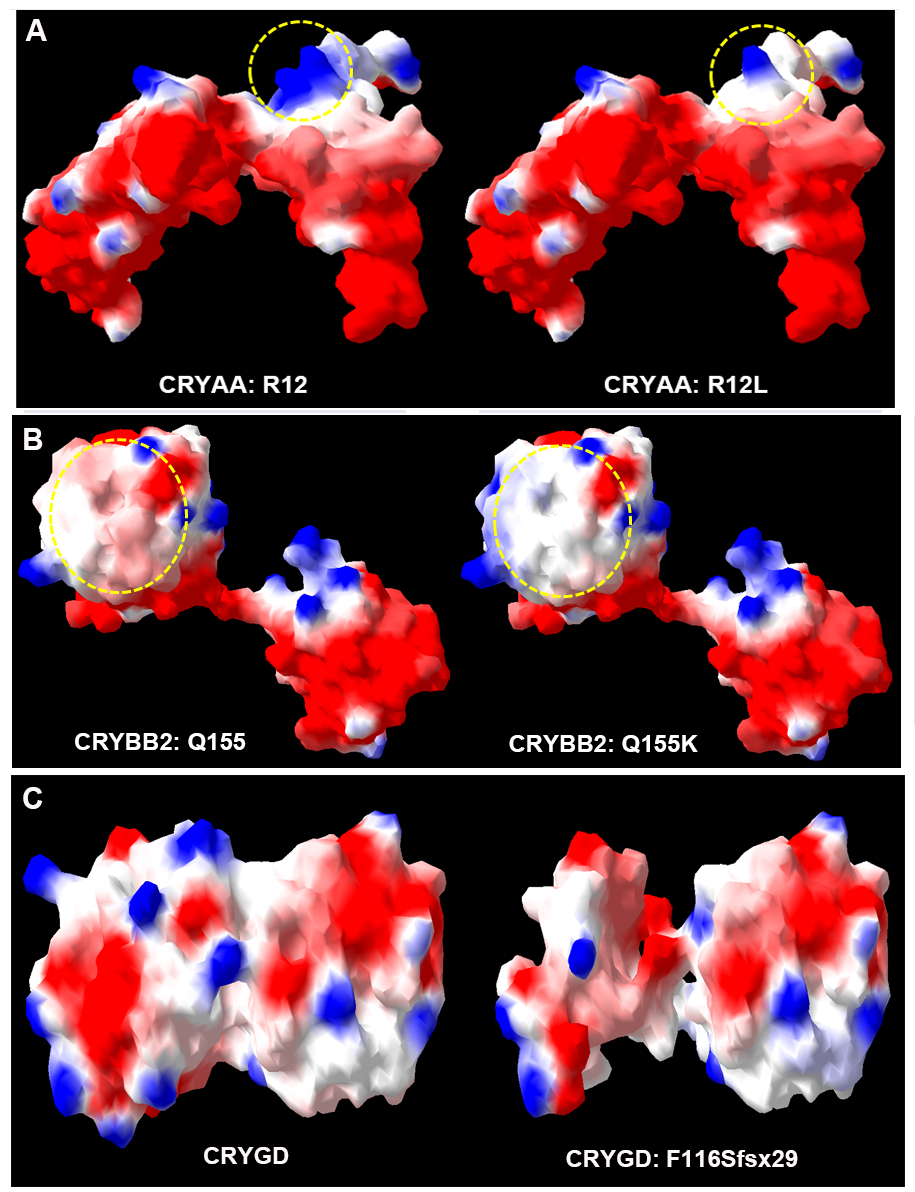
 Figure 3 of
Zhuang, Mol Vis 2019; 25:427-437.
Figure 3 of
Zhuang, Mol Vis 2019; 25:427-437.