Figure 9. Correlation of changes of light sensitivity and the time constant of “exchange current” in individual cells. On the Х-axis,
the relative sensitivity of a cell to light is plotted; the Y-axis shows the relative “exchange current” magnitude of a rod.
Each point represents one cell. A: Correlation graph for dopamine (at 50 µM; n = 6). B: Correlation graph for D1R agonist SKF-38393 (at 50 µM; n = 7). C: Correlation graph for D2R agonist quinpirole (50 µM; n = 5). D: Correlation graph for D1–D2 receptor agonist SKF-83959 (at 50 µM; n = 5).
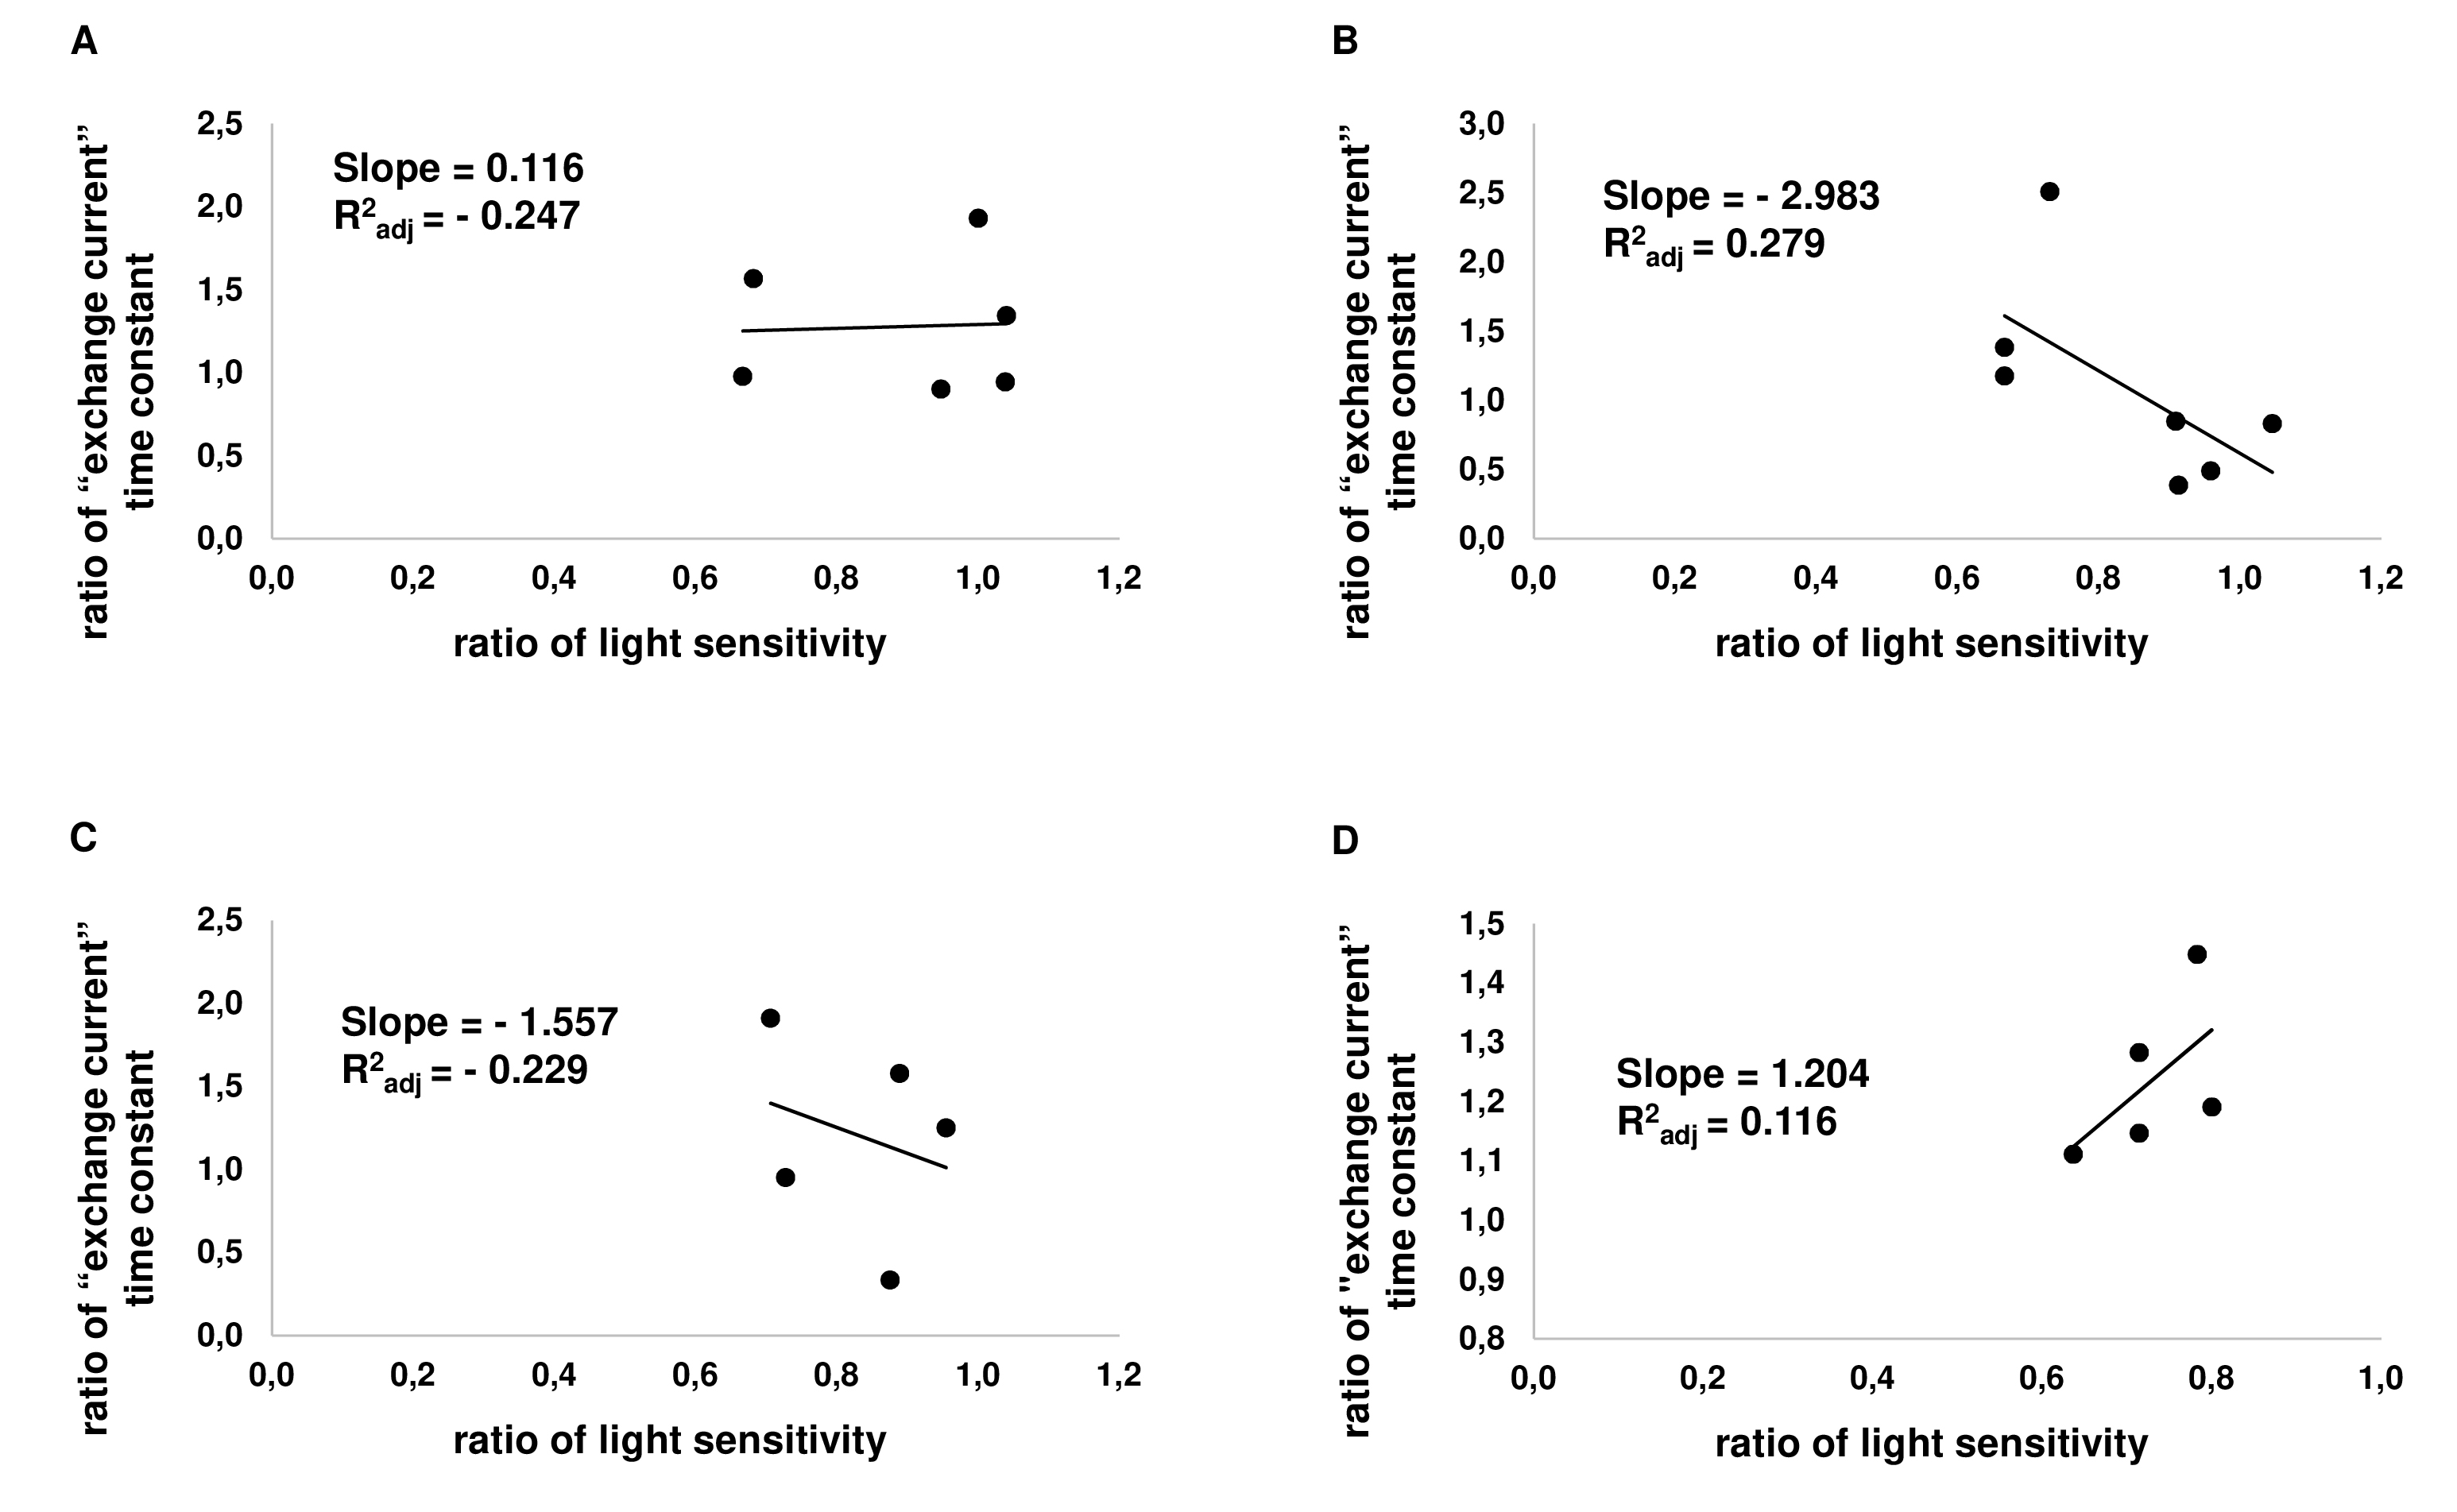
 Figure 9 of
Nikolaeva, Mol Vis 2019; 25:400-414.
Figure 9 of
Nikolaeva, Mol Vis 2019; 25:400-414.