Figure 4. Consistency between TonoVet and Tonopen measurements was evaluated using the Bland–Altman analysis in animals with different
IOP levels in the COHT monkey group. The averages are shown plotted against the deviations. Higher intraocular pressure (IOP)
values were associated with worse consistency for both tonometers. The solid line represents the average deviation, and the
dotted lines indicate the 95% limits of the confidence intervals.
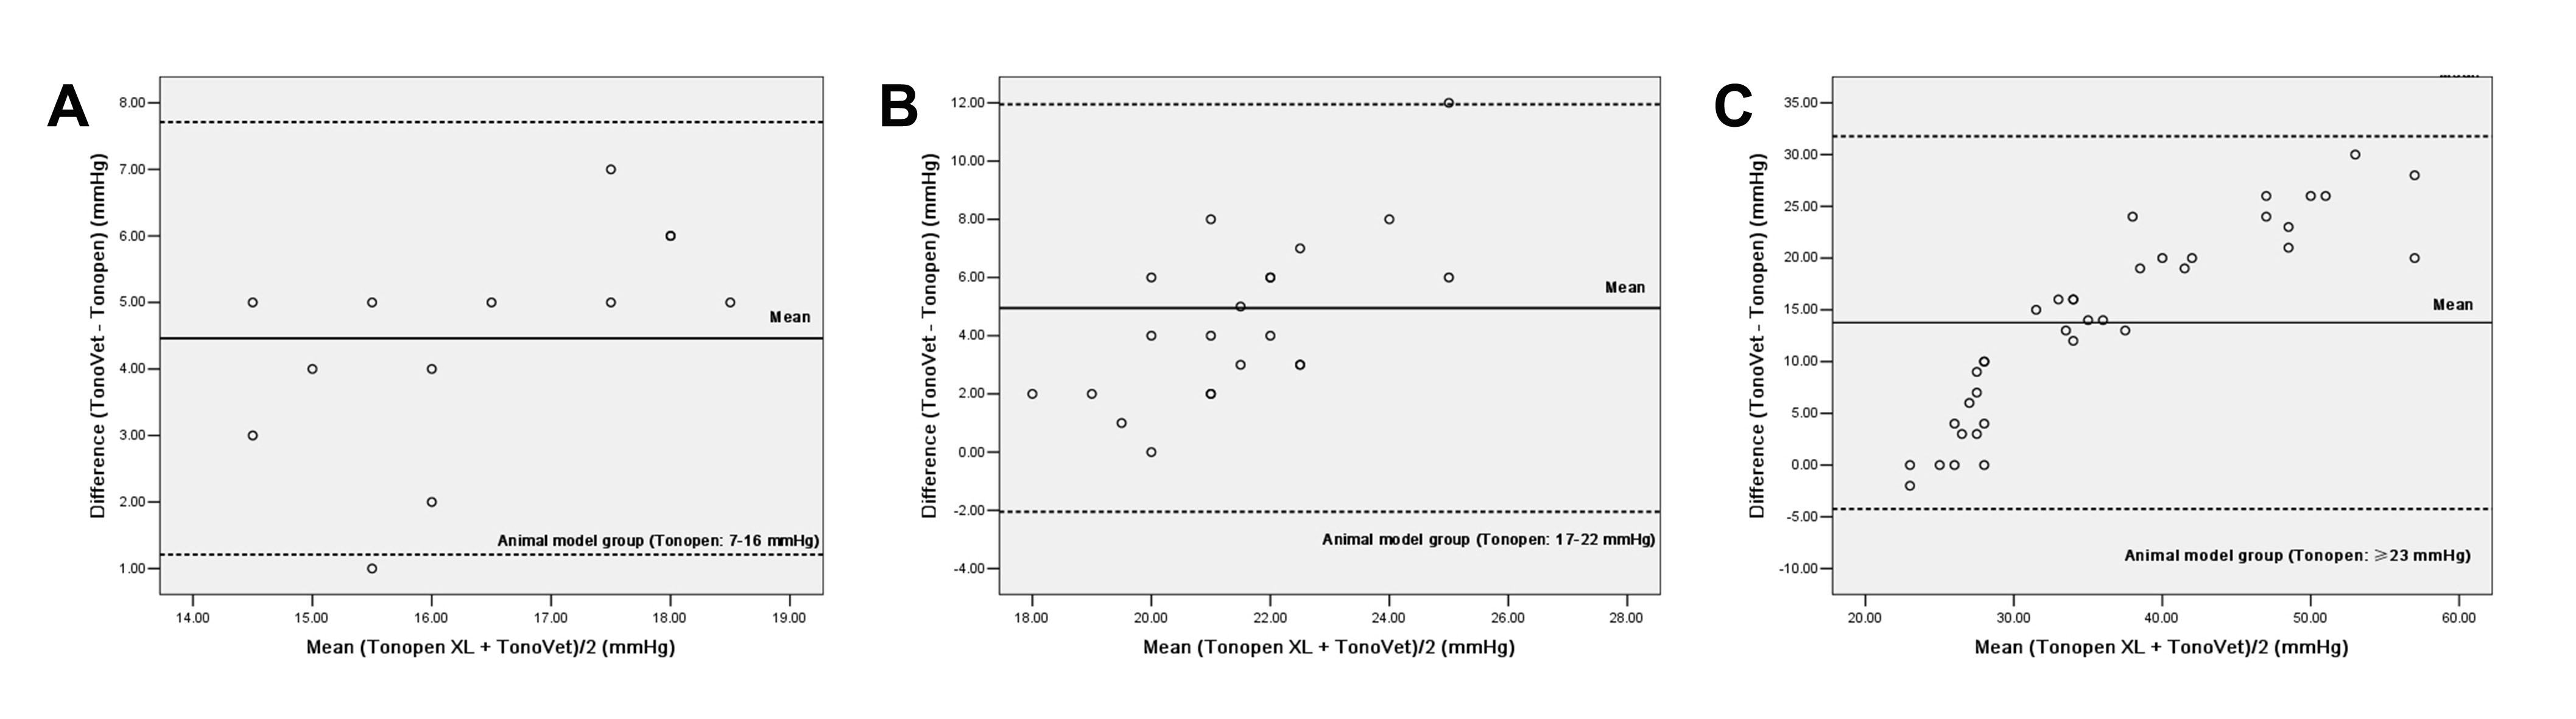
 Figure 4 of
Tu, Mol Vis 2019; 25:391-399.
Figure 4 of
Tu, Mol Vis 2019; 25:391-399.