Figure 3. Consistency analysis in COHT monkey models. A: Regression analysis between TonoVet rebound and Tonopen applanation tonometer readings (n= 72 readings); B: Deviations in IOP values (calculated as TonoVet minus Tonopen) are shown plotted against the average IOP ((TonoVet plus
Tonopen)/2). The solid line represents the regression line, and the dotted lines represent 95% confidence interval limits.
Duplicates were distributed in the graph.
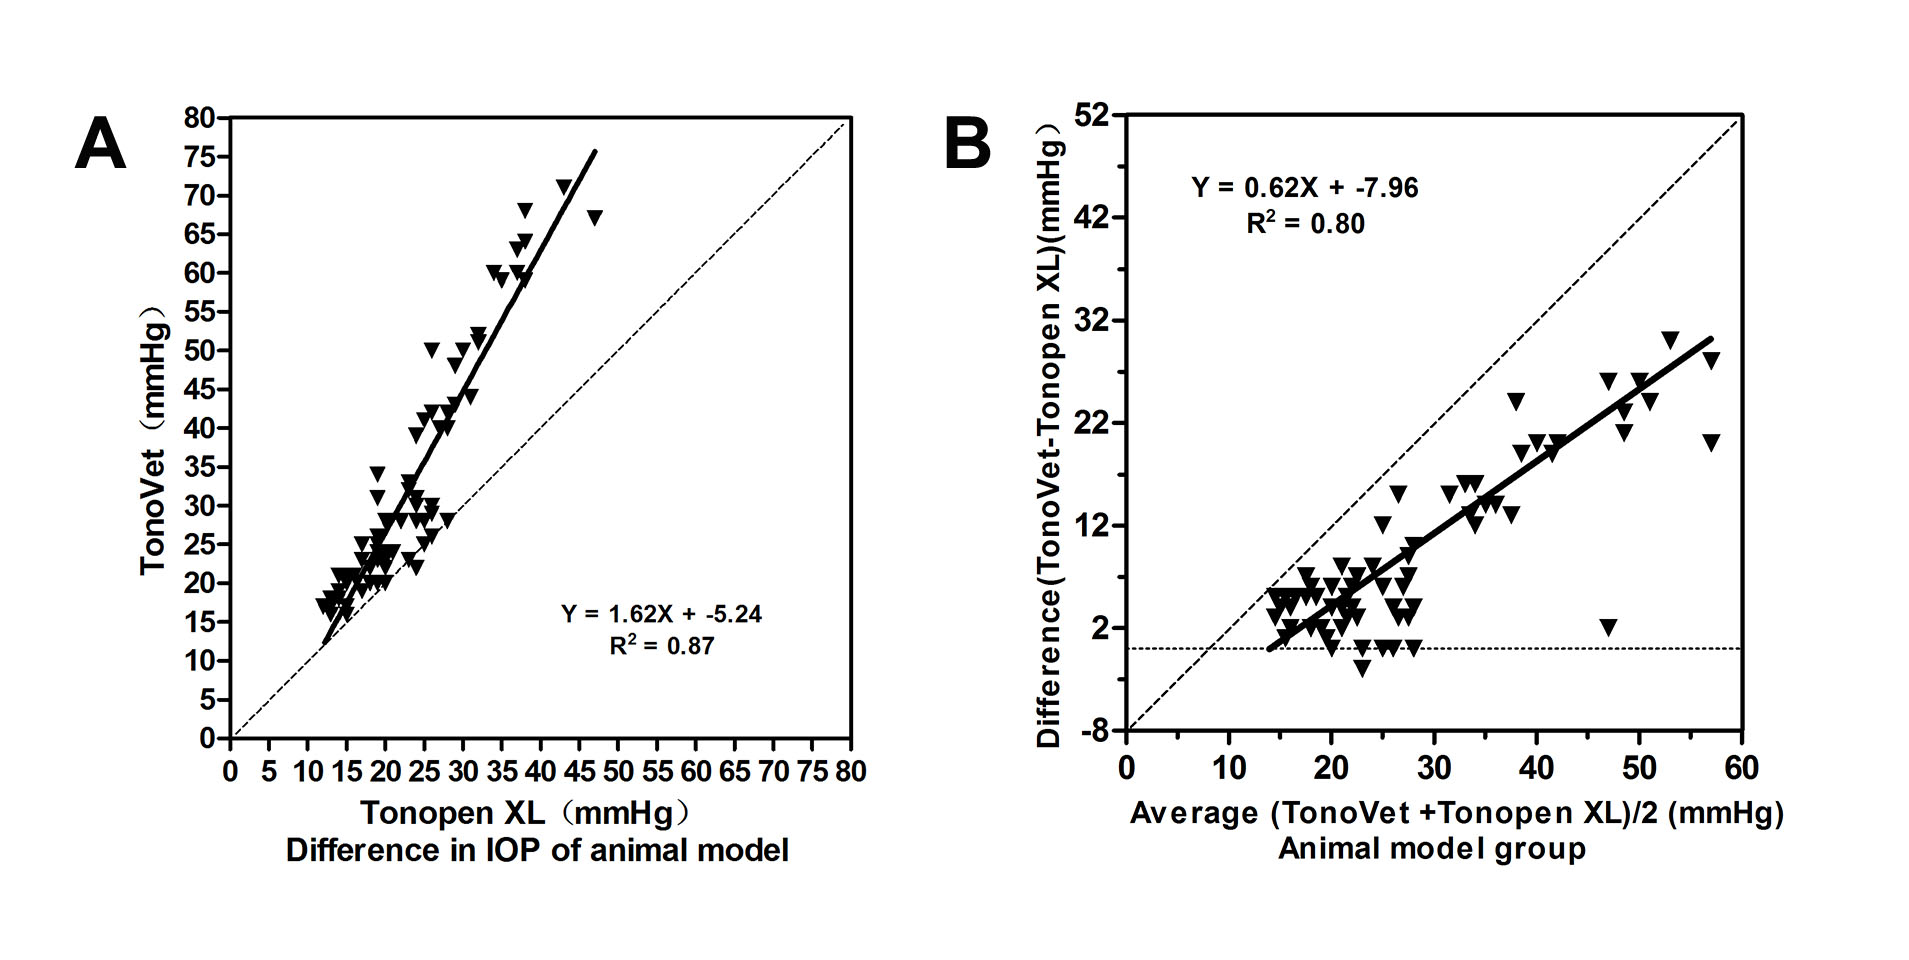
 Figure 3 of
Tu, Mol Vis 2019; 25:391-399.
Figure 3 of
Tu, Mol Vis 2019; 25:391-399.