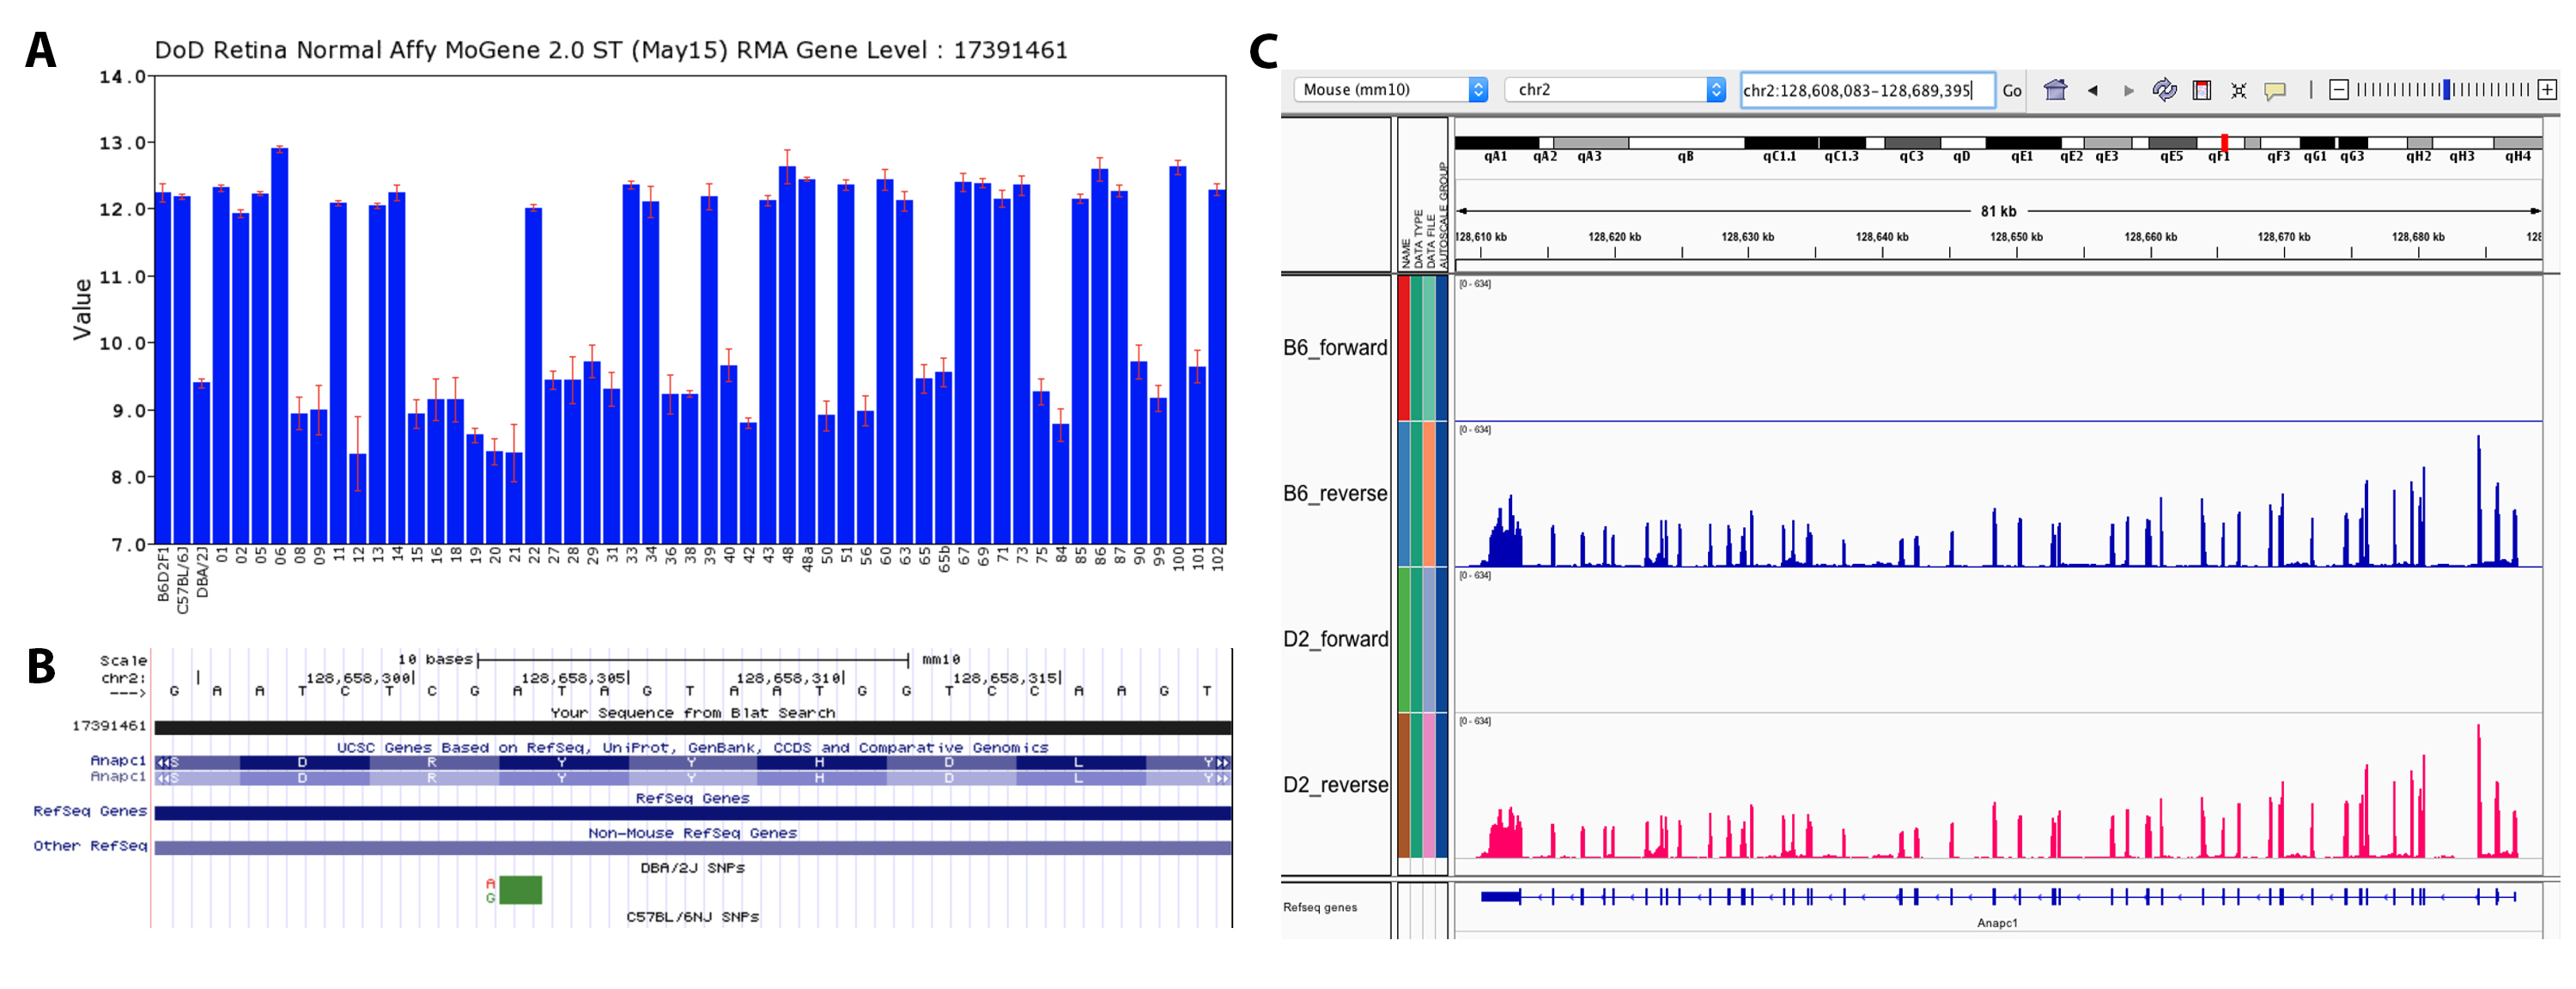
Figure 7. An example of a false differentially expressed gene.
A: Expression level of Anapc1 mRNA (y-axis) across the BXD strains (x-axis) from the Department of Defense (DoD) database (Probe_17391461).
B: Probe verification at UCSC demonstrates that there is a single nucleotide polymorphism (SNP;
rs27412956) in the probe coverage area which may lead to mis-binding toward the D2 sequence.
C: This gene is identified as not differentially expressed in the RNA sequencing (RNA-seq) data. Viewing the RNA-seq signal
in the Integrative Genomics Viewer (
IGV) browser shows equal expression between the two stains across all exons, indicating that this is a false positive differentially
expressed gene using microarray methodology.
 Figure 7 of
Wang, Mol Vis 2019; 25:345-358.
Figure 7 of
Wang, Mol Vis 2019; 25:345-358.