Figure 5. Correlation between the RNA-seq data set and the microarray data set for differentially expressed genes. Differences (the
B6 and D2 mice) of the mean expression value (Z-score) for each transcript are compared between the RNA sequencing (RNA-seq)
and microarray data sets. The Pearson’s r value is 0.408 (p<0.001), indicating good agreement between the two data sets in
detecting differentially expressed genes. The blue line indicates a linear fit with gray-shaded 95% confidence intervals.
DE, differential expression.
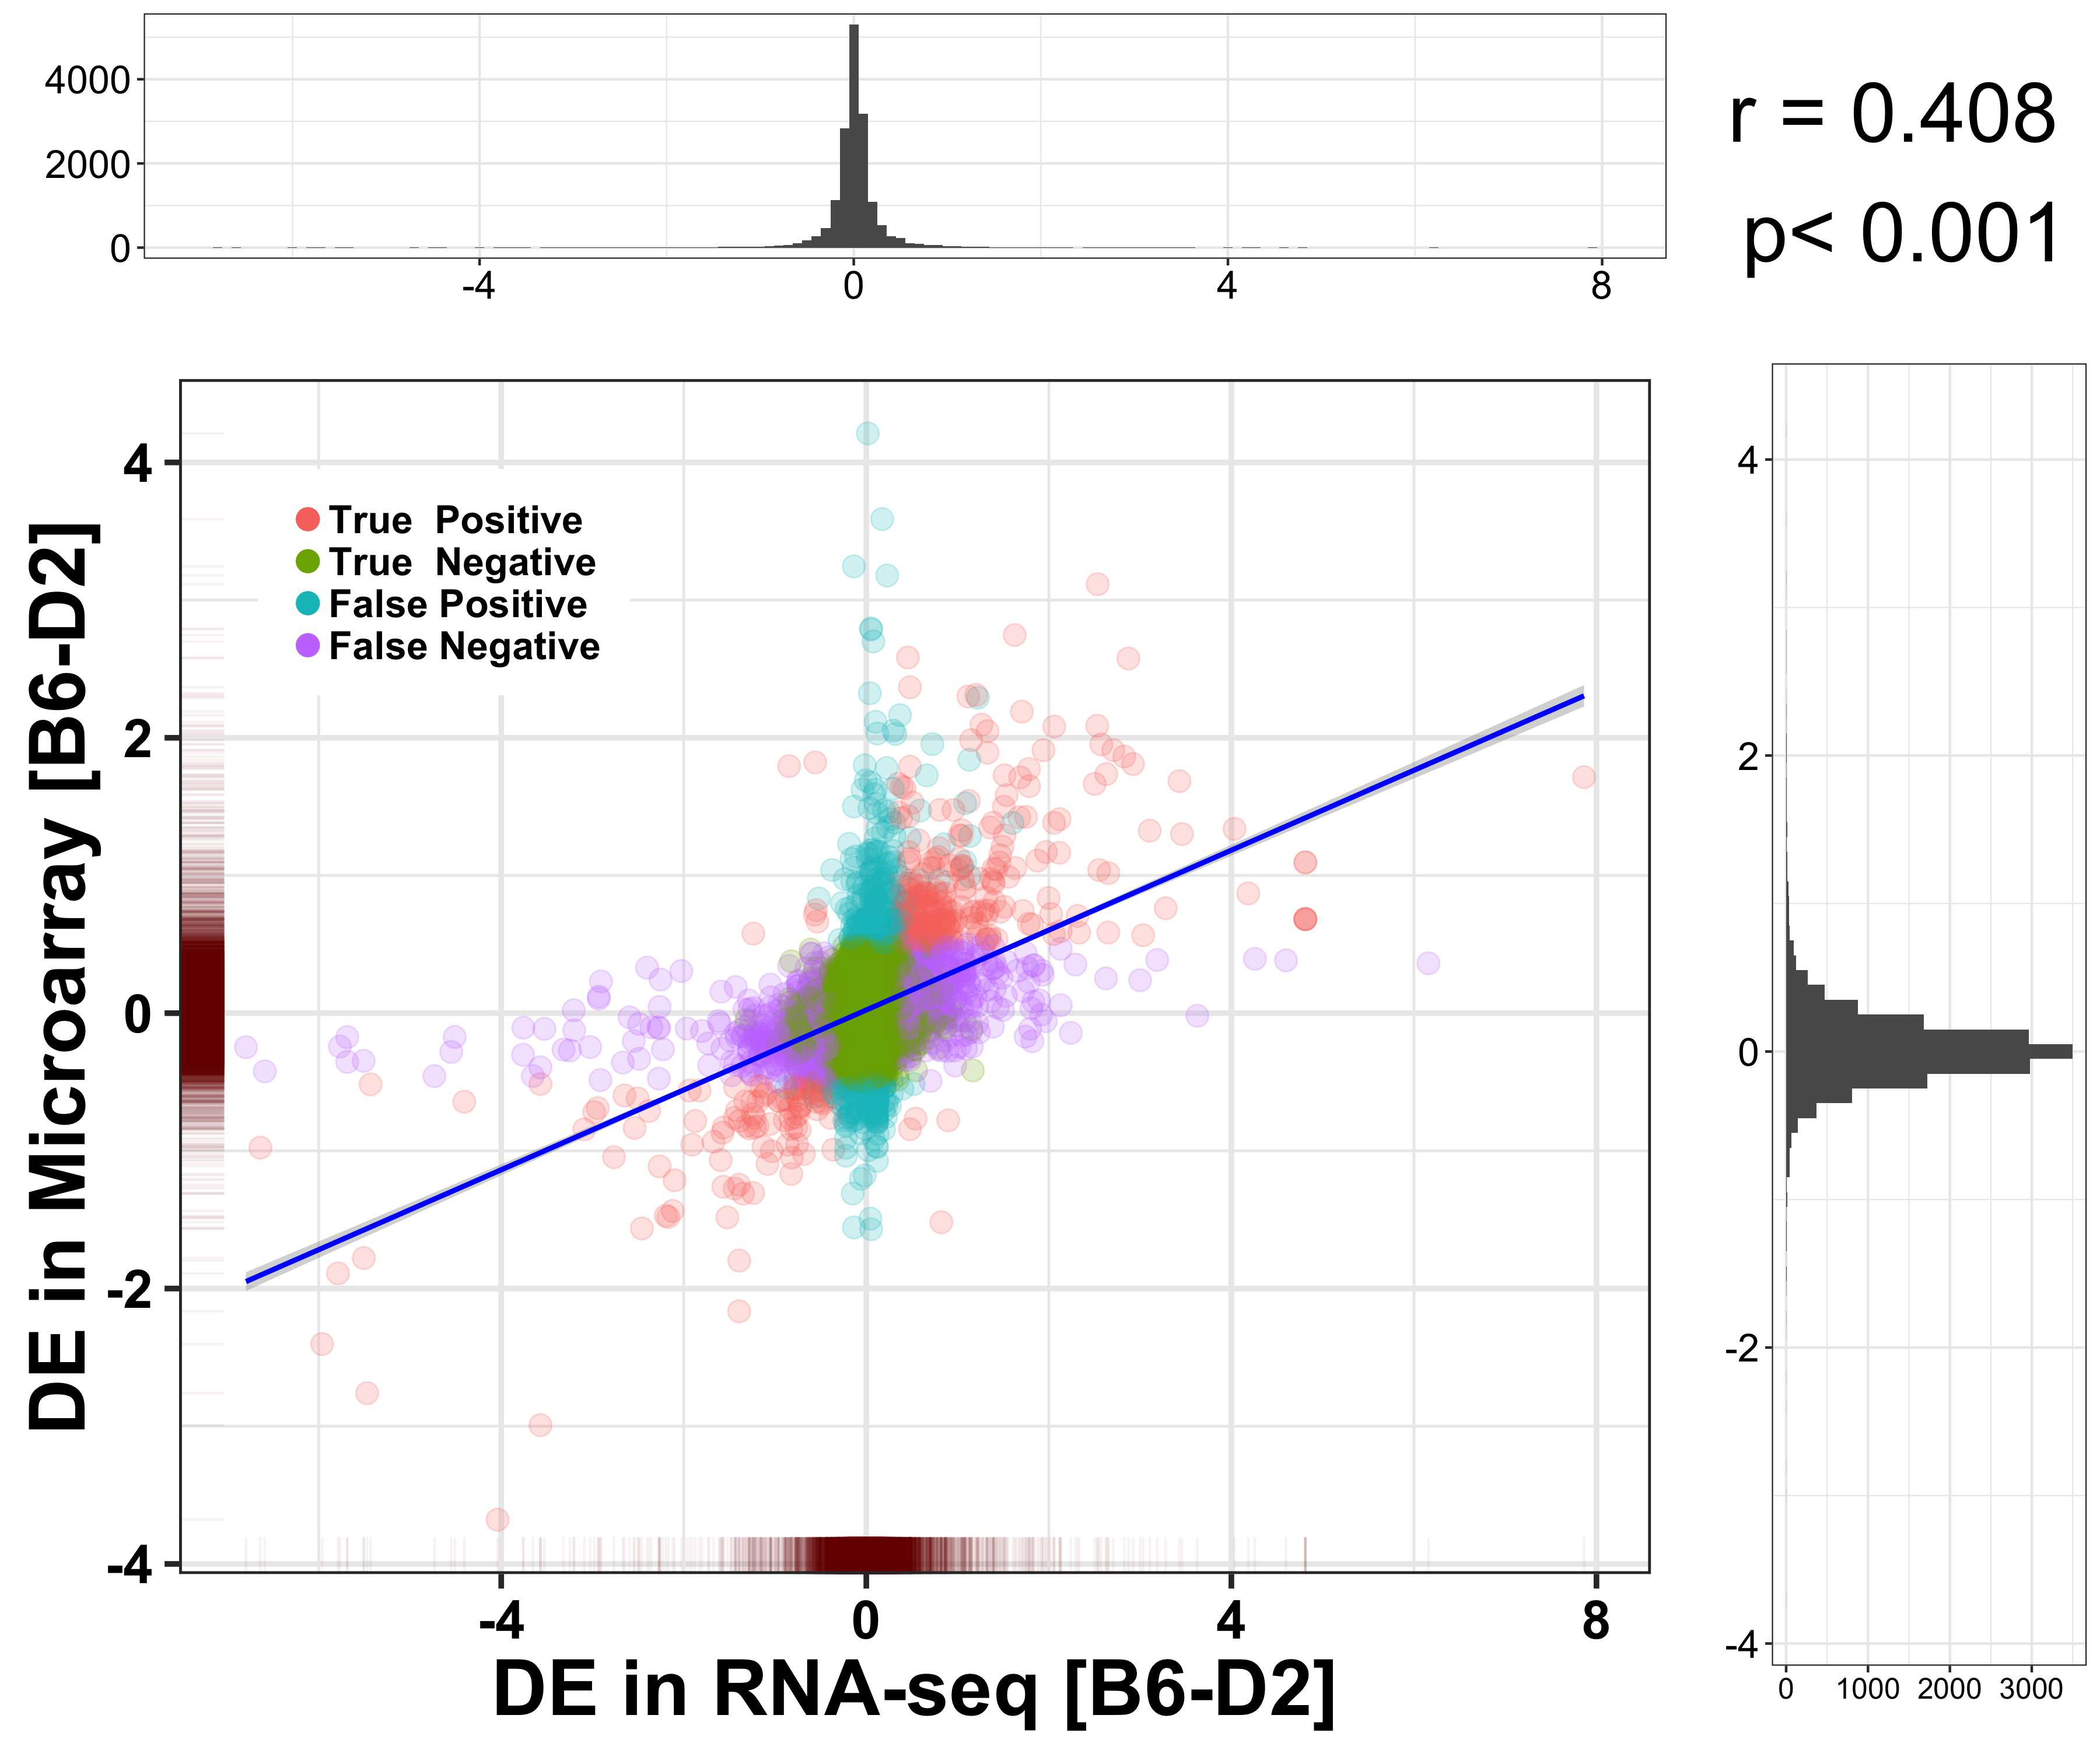
 Figure 5 of
Wang, Mol Vis 2019; 25:345-358.
Figure 5 of
Wang, Mol Vis 2019; 25:345-358.