Figure 4. Correlation between the RNA-seq and microarray data sets for B6 and D2 mice. Mean expression values of each gene were used
for the RNA sequencing (RNA-seq) and microarray data sets. The Pearson’s r value was 0.780 for B6 (A) and 0.784 for D2 (B), indicating good agreement between the two data sets. The red line shows a linear fit, while the blue line is a smoothed
loess fit with gray-shaded 95% confidence intervals. The good agreement between the red and blue lines indicates that comparisons
between microarray and RNA-seq data are valid, except a few genes with high or low expression, where the linear fit does not
overlap the 95% confidence interval.
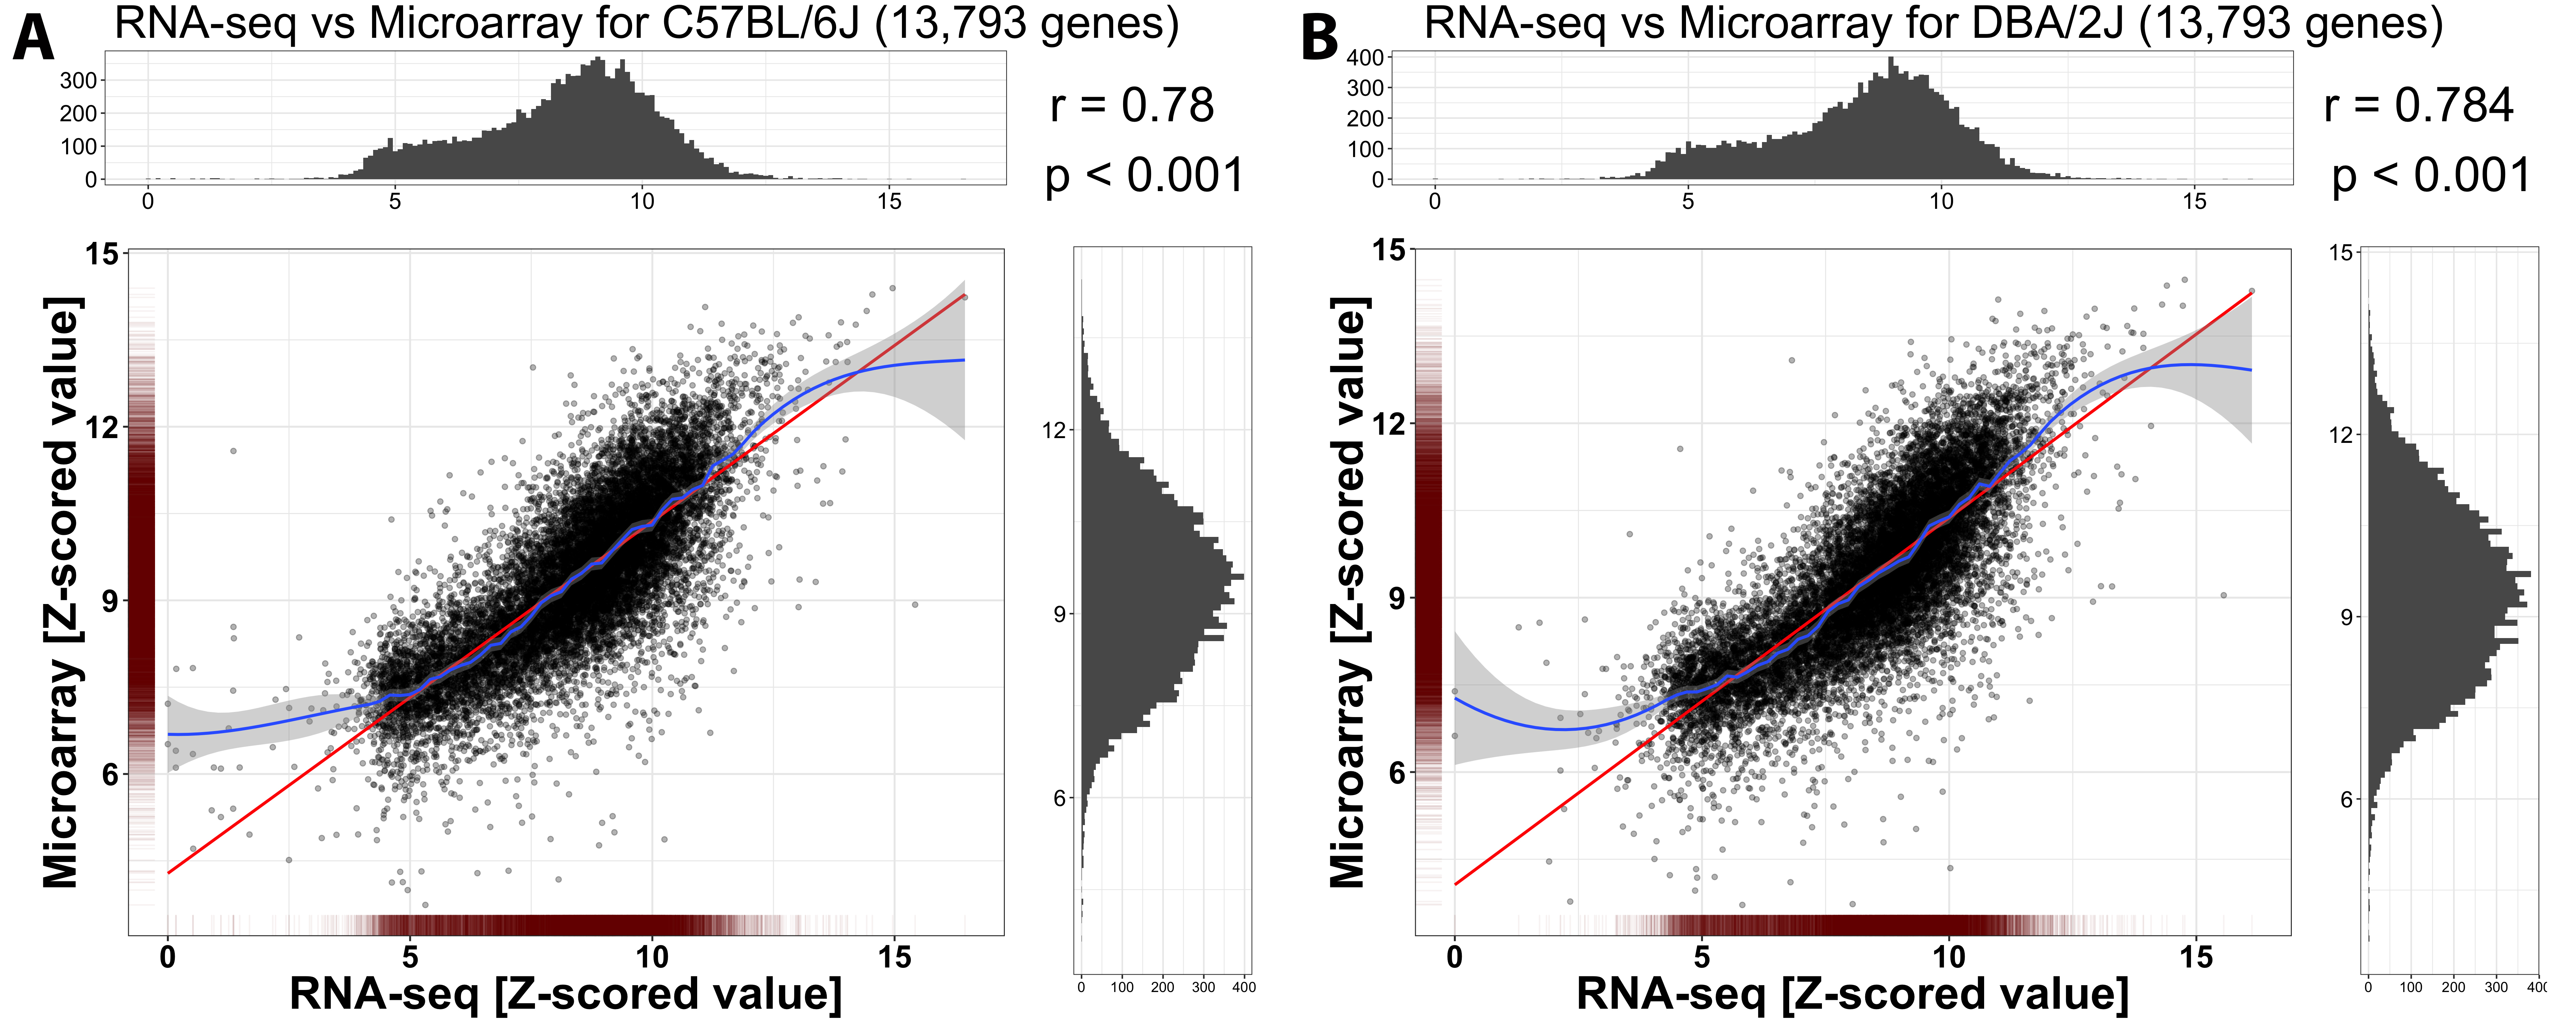
 Figure 4 of
Wang, Mol Vis 2019; 25:345-358.
Figure 4 of
Wang, Mol Vis 2019; 25:345-358.