Figure 2. Enrichment analysis of differentially expressed genes between B6 and D2 retinas. (A) Biologic Processes, (B) Molecular Function, and (C) Cellular Components. Several additional databases were examined, including Mammalian phenotypes in Mouse (D) and in Human (E), which are presented along with enrichment in the Reactome (F). Each bar chart shows the top five enriched pathways. The adjusted p value of the enrichment is indicated within each bar.
Red asterisks indicate statistically significant enrichments (p<0.01). Genes involved in each pathway are listed in Appendix
3.
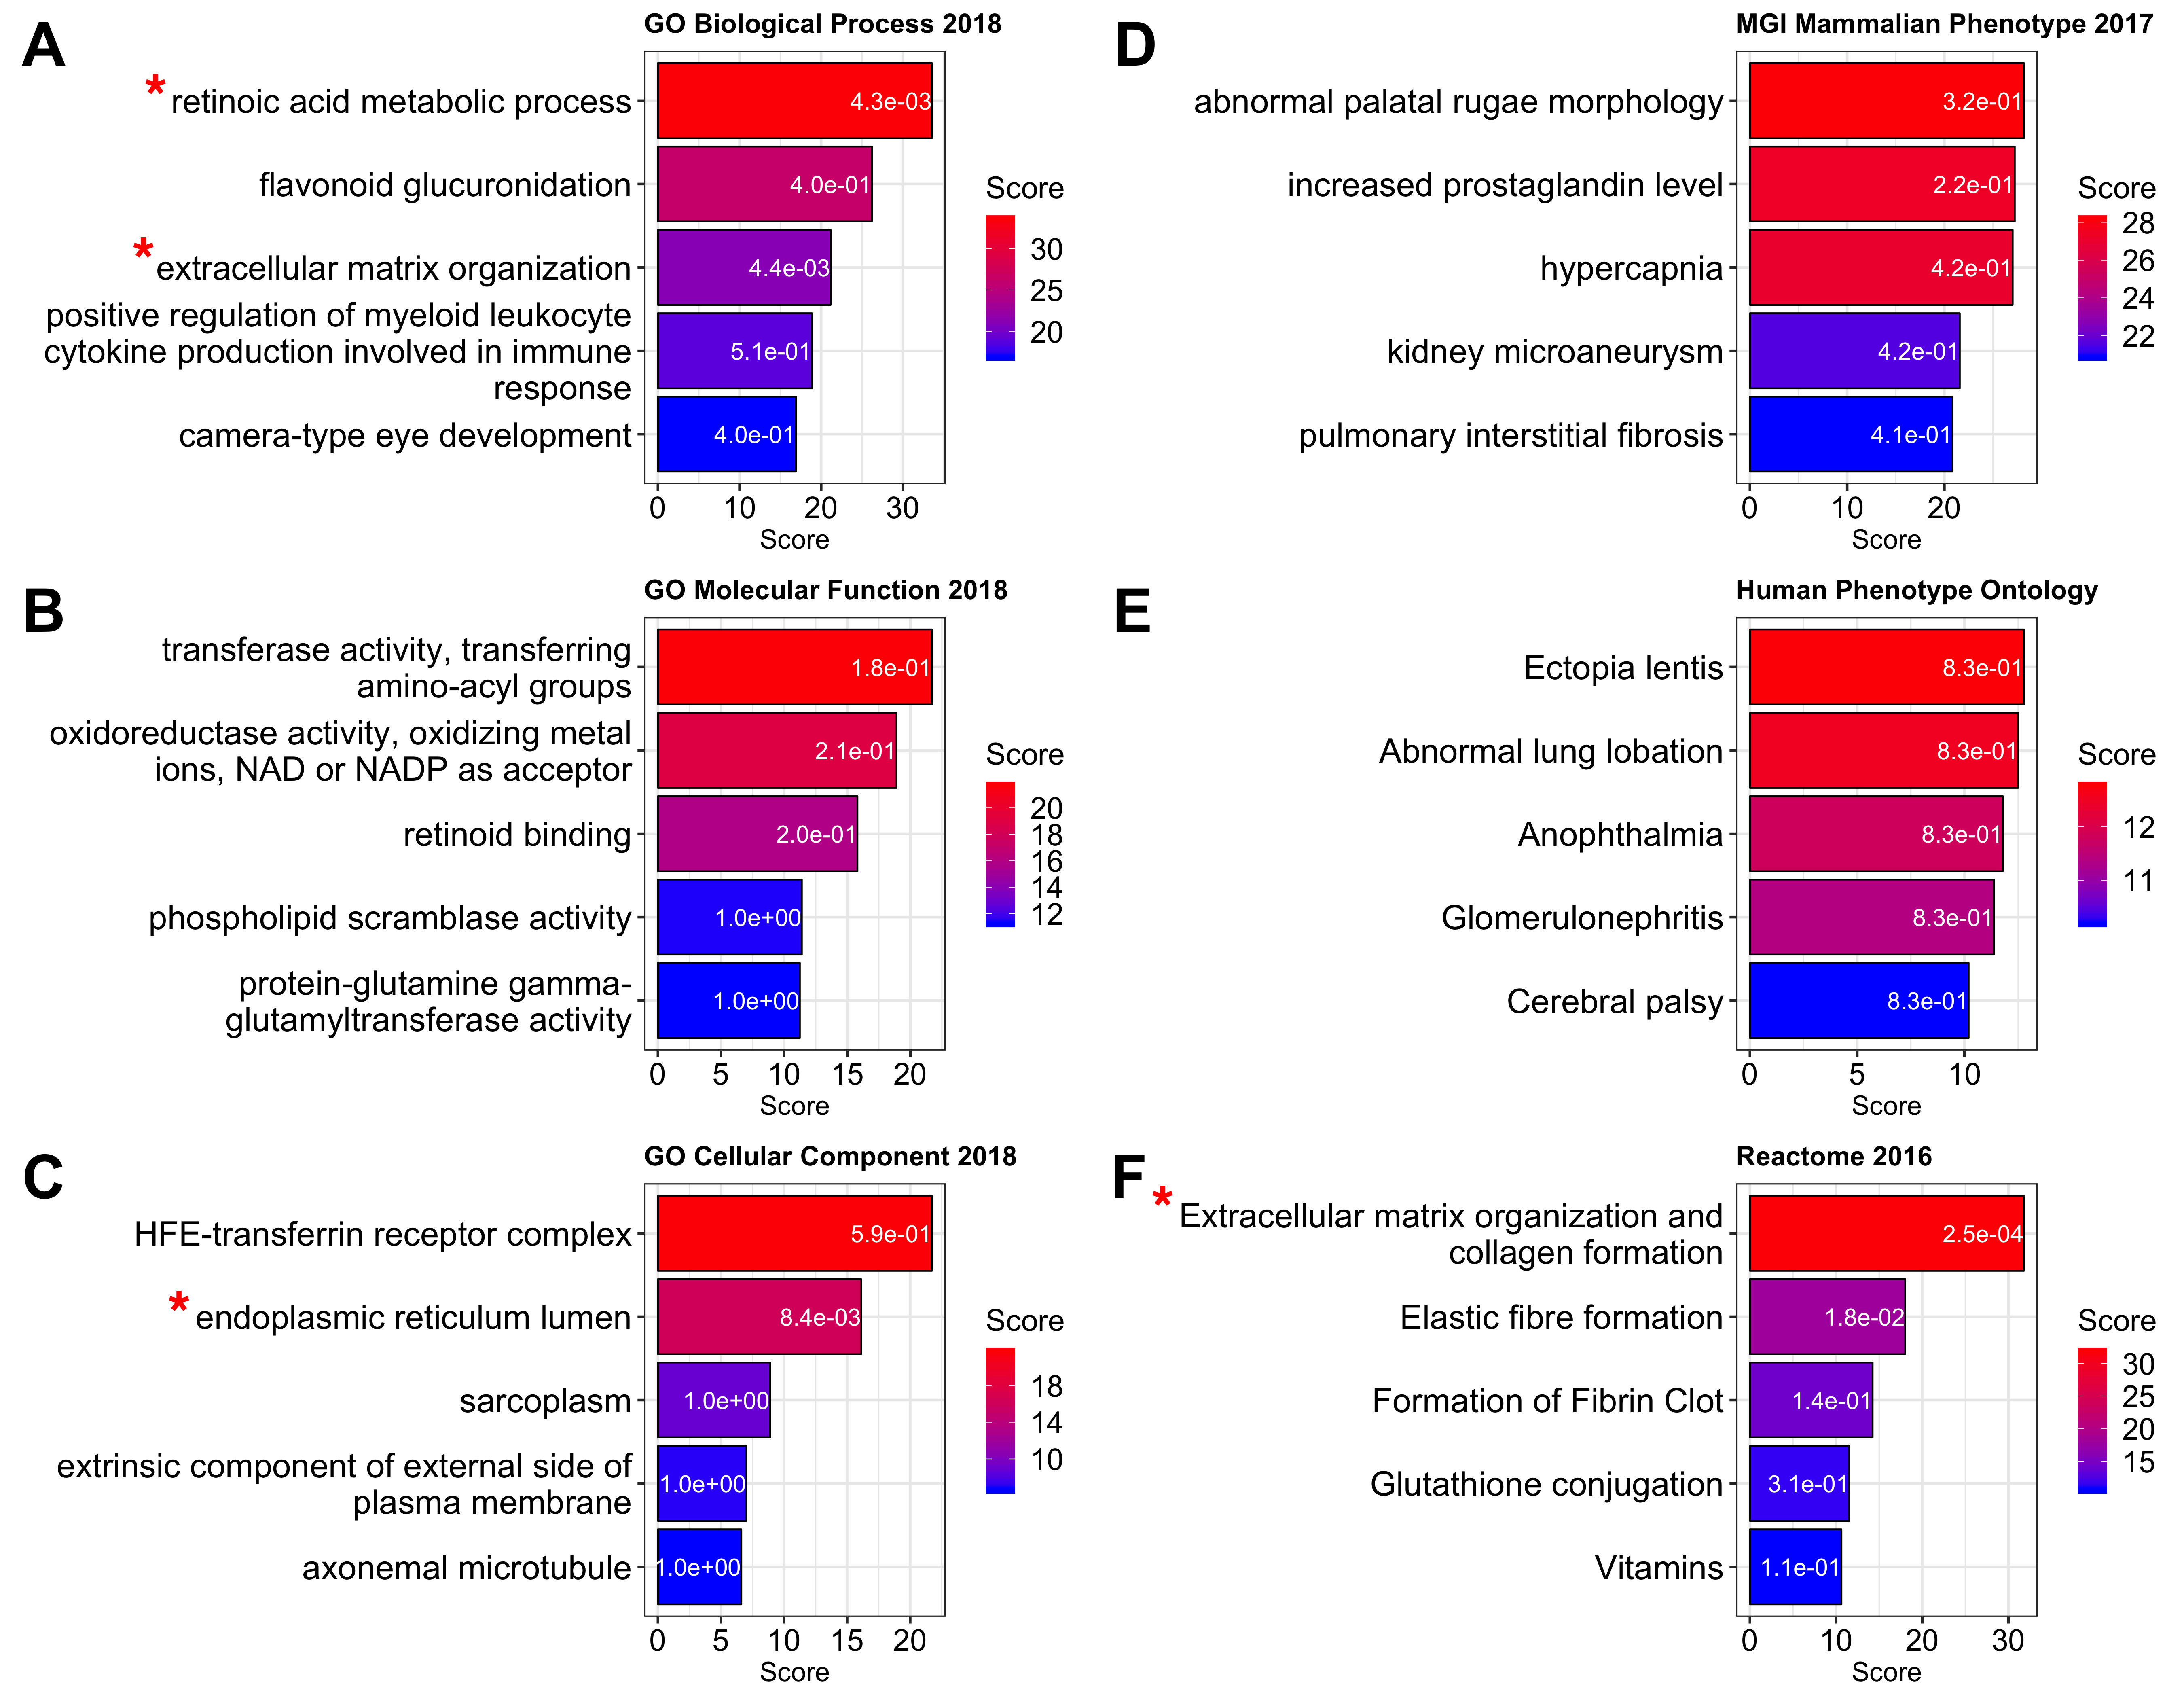
 Figure 2 of
Wang, Mol Vis 2019; 25:345-358.
Figure 2 of
Wang, Mol Vis 2019; 25:345-358.