Figure 1. Transcriptome features of cell-specific markers. Expression levels of signature genes are shown as z-scored log2 values from the RNA sequencing (RNA-seq) data set, with the same z-scaling method also used on GeneNetwork. Thus, every increase
by one unit represents a doubling in expression. Marker genes for cell types or tissues not present in the neural retina show
low to negligible expression. RGC, retinal ganglion cell; RPE, retinal pigment epithelium; D2, DBA/2J mutation genes. Red
asterisks represent differentially expressed genes. The number of reads in counts per million (cpm) for the most expressed
gene (Rho) is 1,369,988±114,467for the B6 mice and 958,400±43,184 for the D2 mice. The cpm for the lowest expressed gene in this figure
(Upk1b) is 36±8.0 for the B6 mice and 23±5.0 for the D2 mice. Raw reads for all genes are available from the Gene Expression Omnibus
(GEO), accession GSE127942.
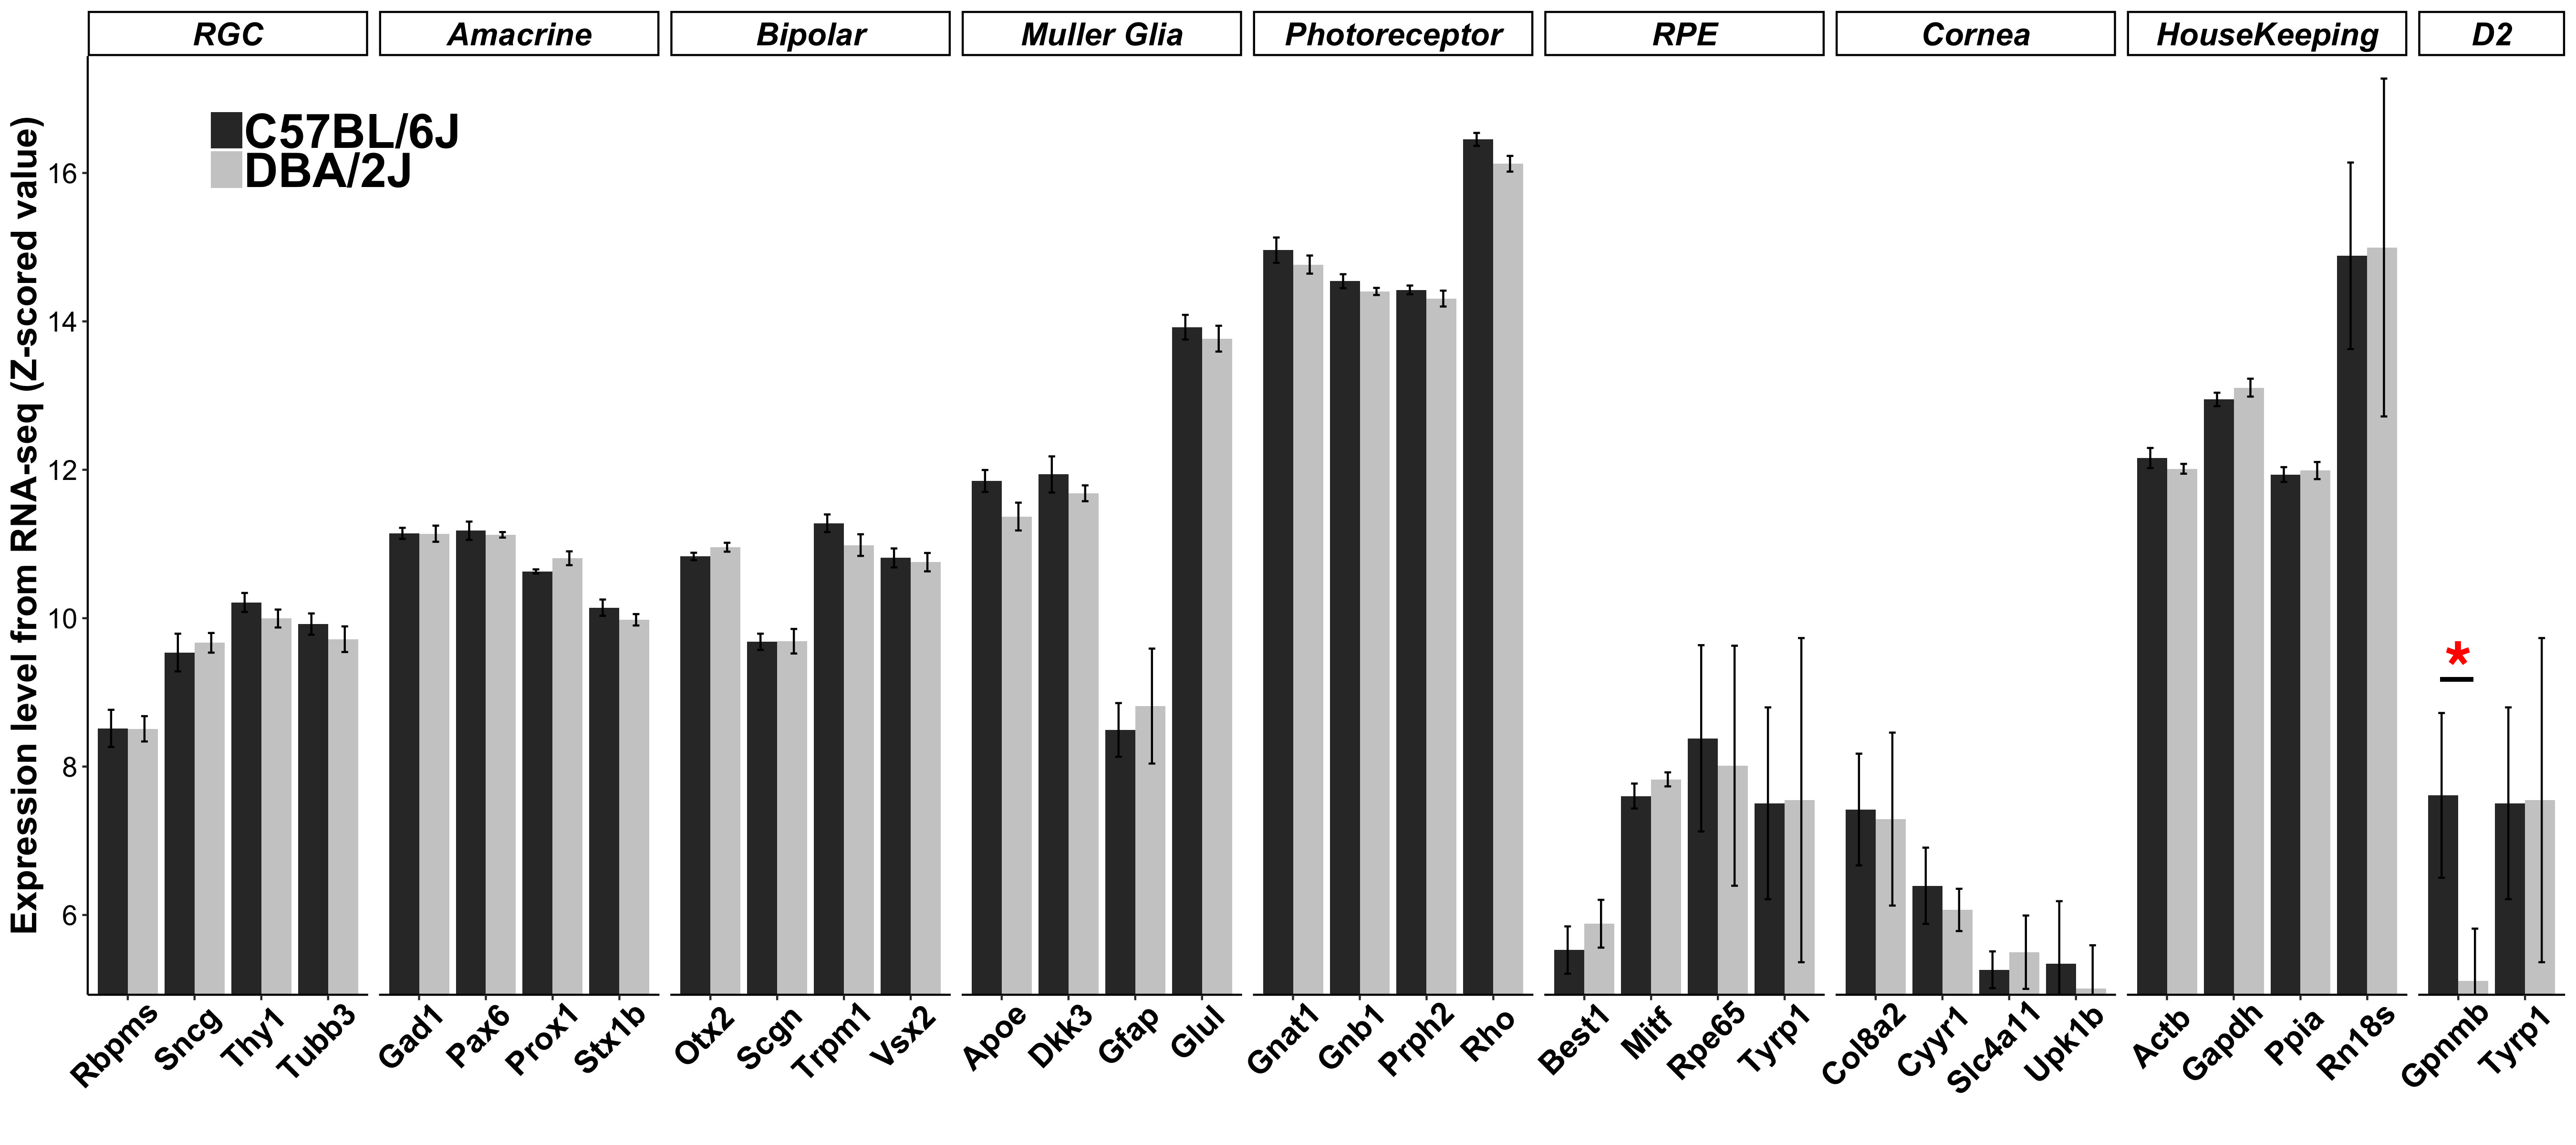
 Figure 1 of
Wang, Mol Vis 2019; 25:345-358.
Figure 1 of
Wang, Mol Vis 2019; 25:345-358.