 Appendix 5 of
Wang, Mol Vis 2019; 25:345-358.
Appendix 5 of
Wang, Mol Vis 2019; 25:345-358. Appendix 5 of
Wang, Mol Vis 2019; 25:345-358.
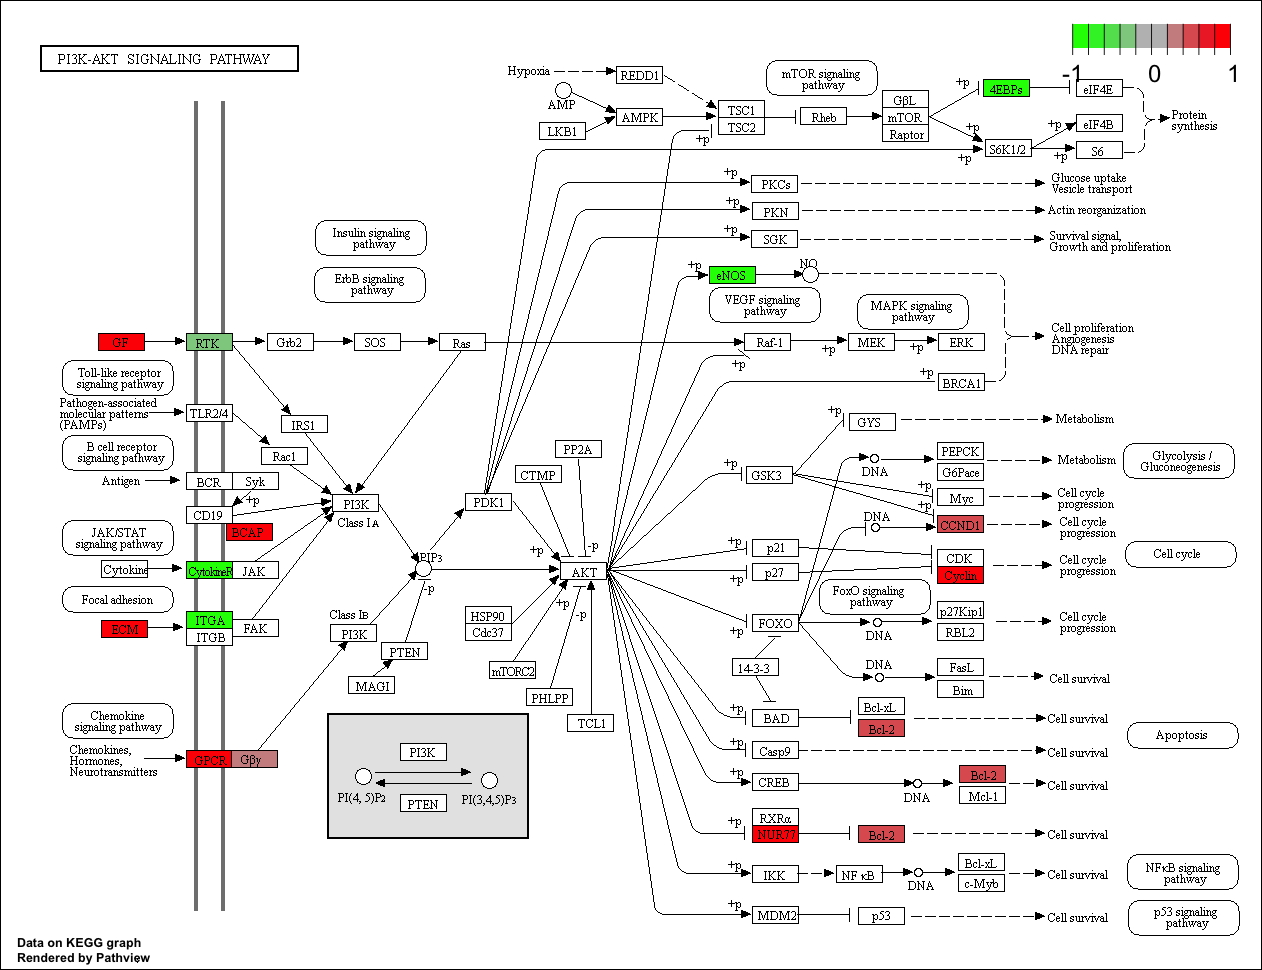
Appendix 5. DE genes involvement of the PI3K-Akt signaling pathway.
To access the data, click or select the words “Appendix 5.” The differences of expression are calculated as B6 minus D2. In the figure, Red means a positive value of DE, which indicates that the gene is higher expressed in B6 than D2. Green means a negative value of DE, which indicates that the gene is higher expressed in D2 than B6.