 Appendix 15 of
Wang, Mol Vis 2019; 25:345-358.
Appendix 15 of
Wang, Mol Vis 2019; 25:345-358. Appendix 15 of
Wang, Mol Vis 2019; 25:345-358.
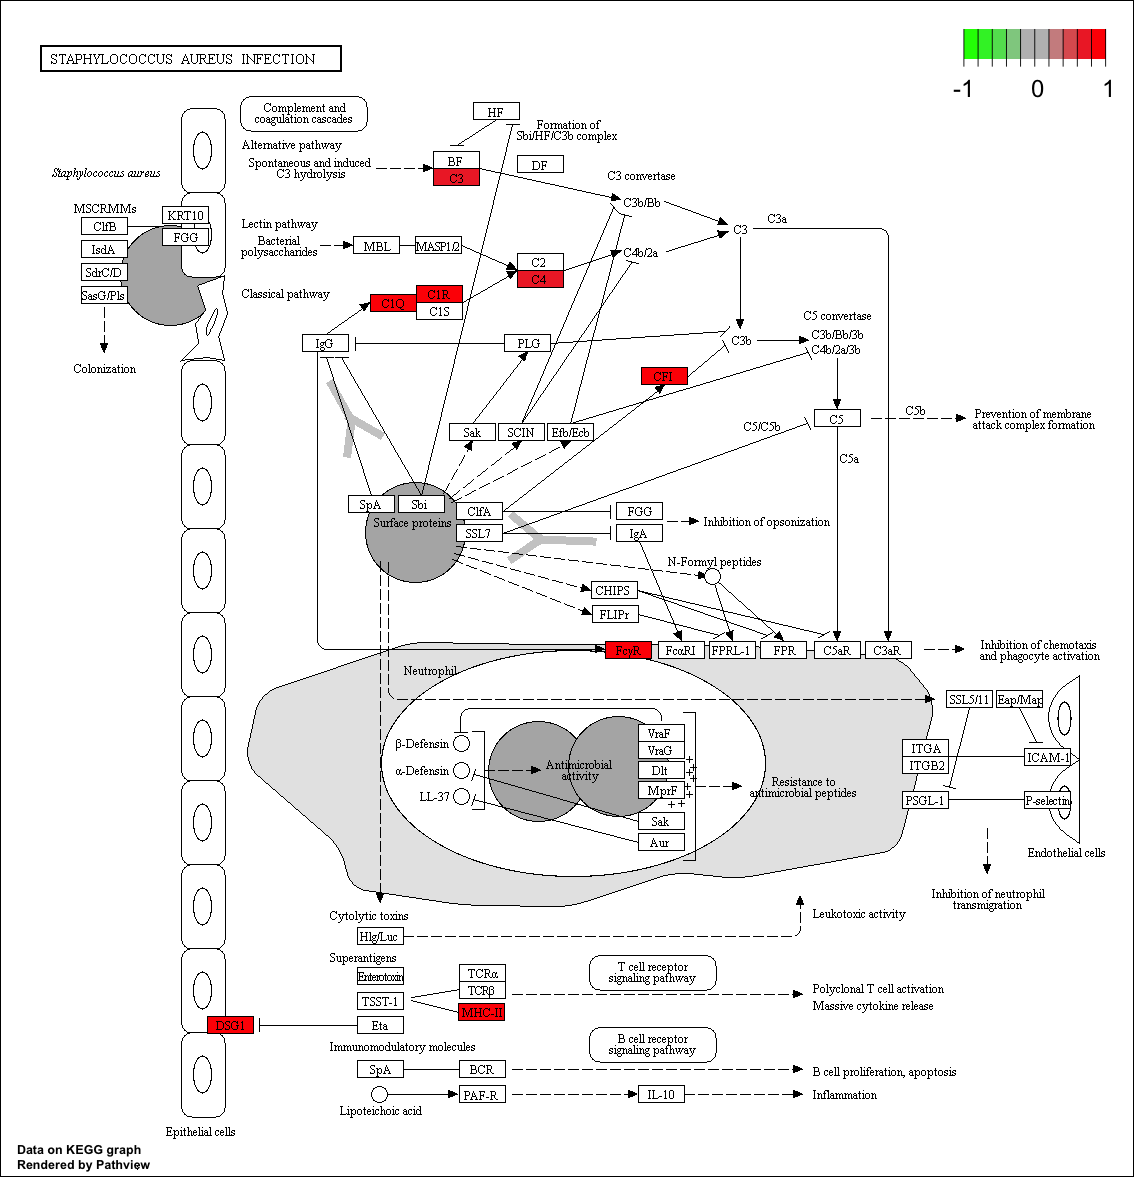
Appendix 15. DE genes involvement of the staphylococcus aureus infection pathway
To access the data, click or select the words “Appendix 15.” The differences of expression are calculated as B6 minus D2. In the figure, Red means a positive value of DE, which indicates that the gene is higher expressed in B6 than D2. Green means a negative value of DE, which indicates that the gene is higher expressed in D2 than B6.