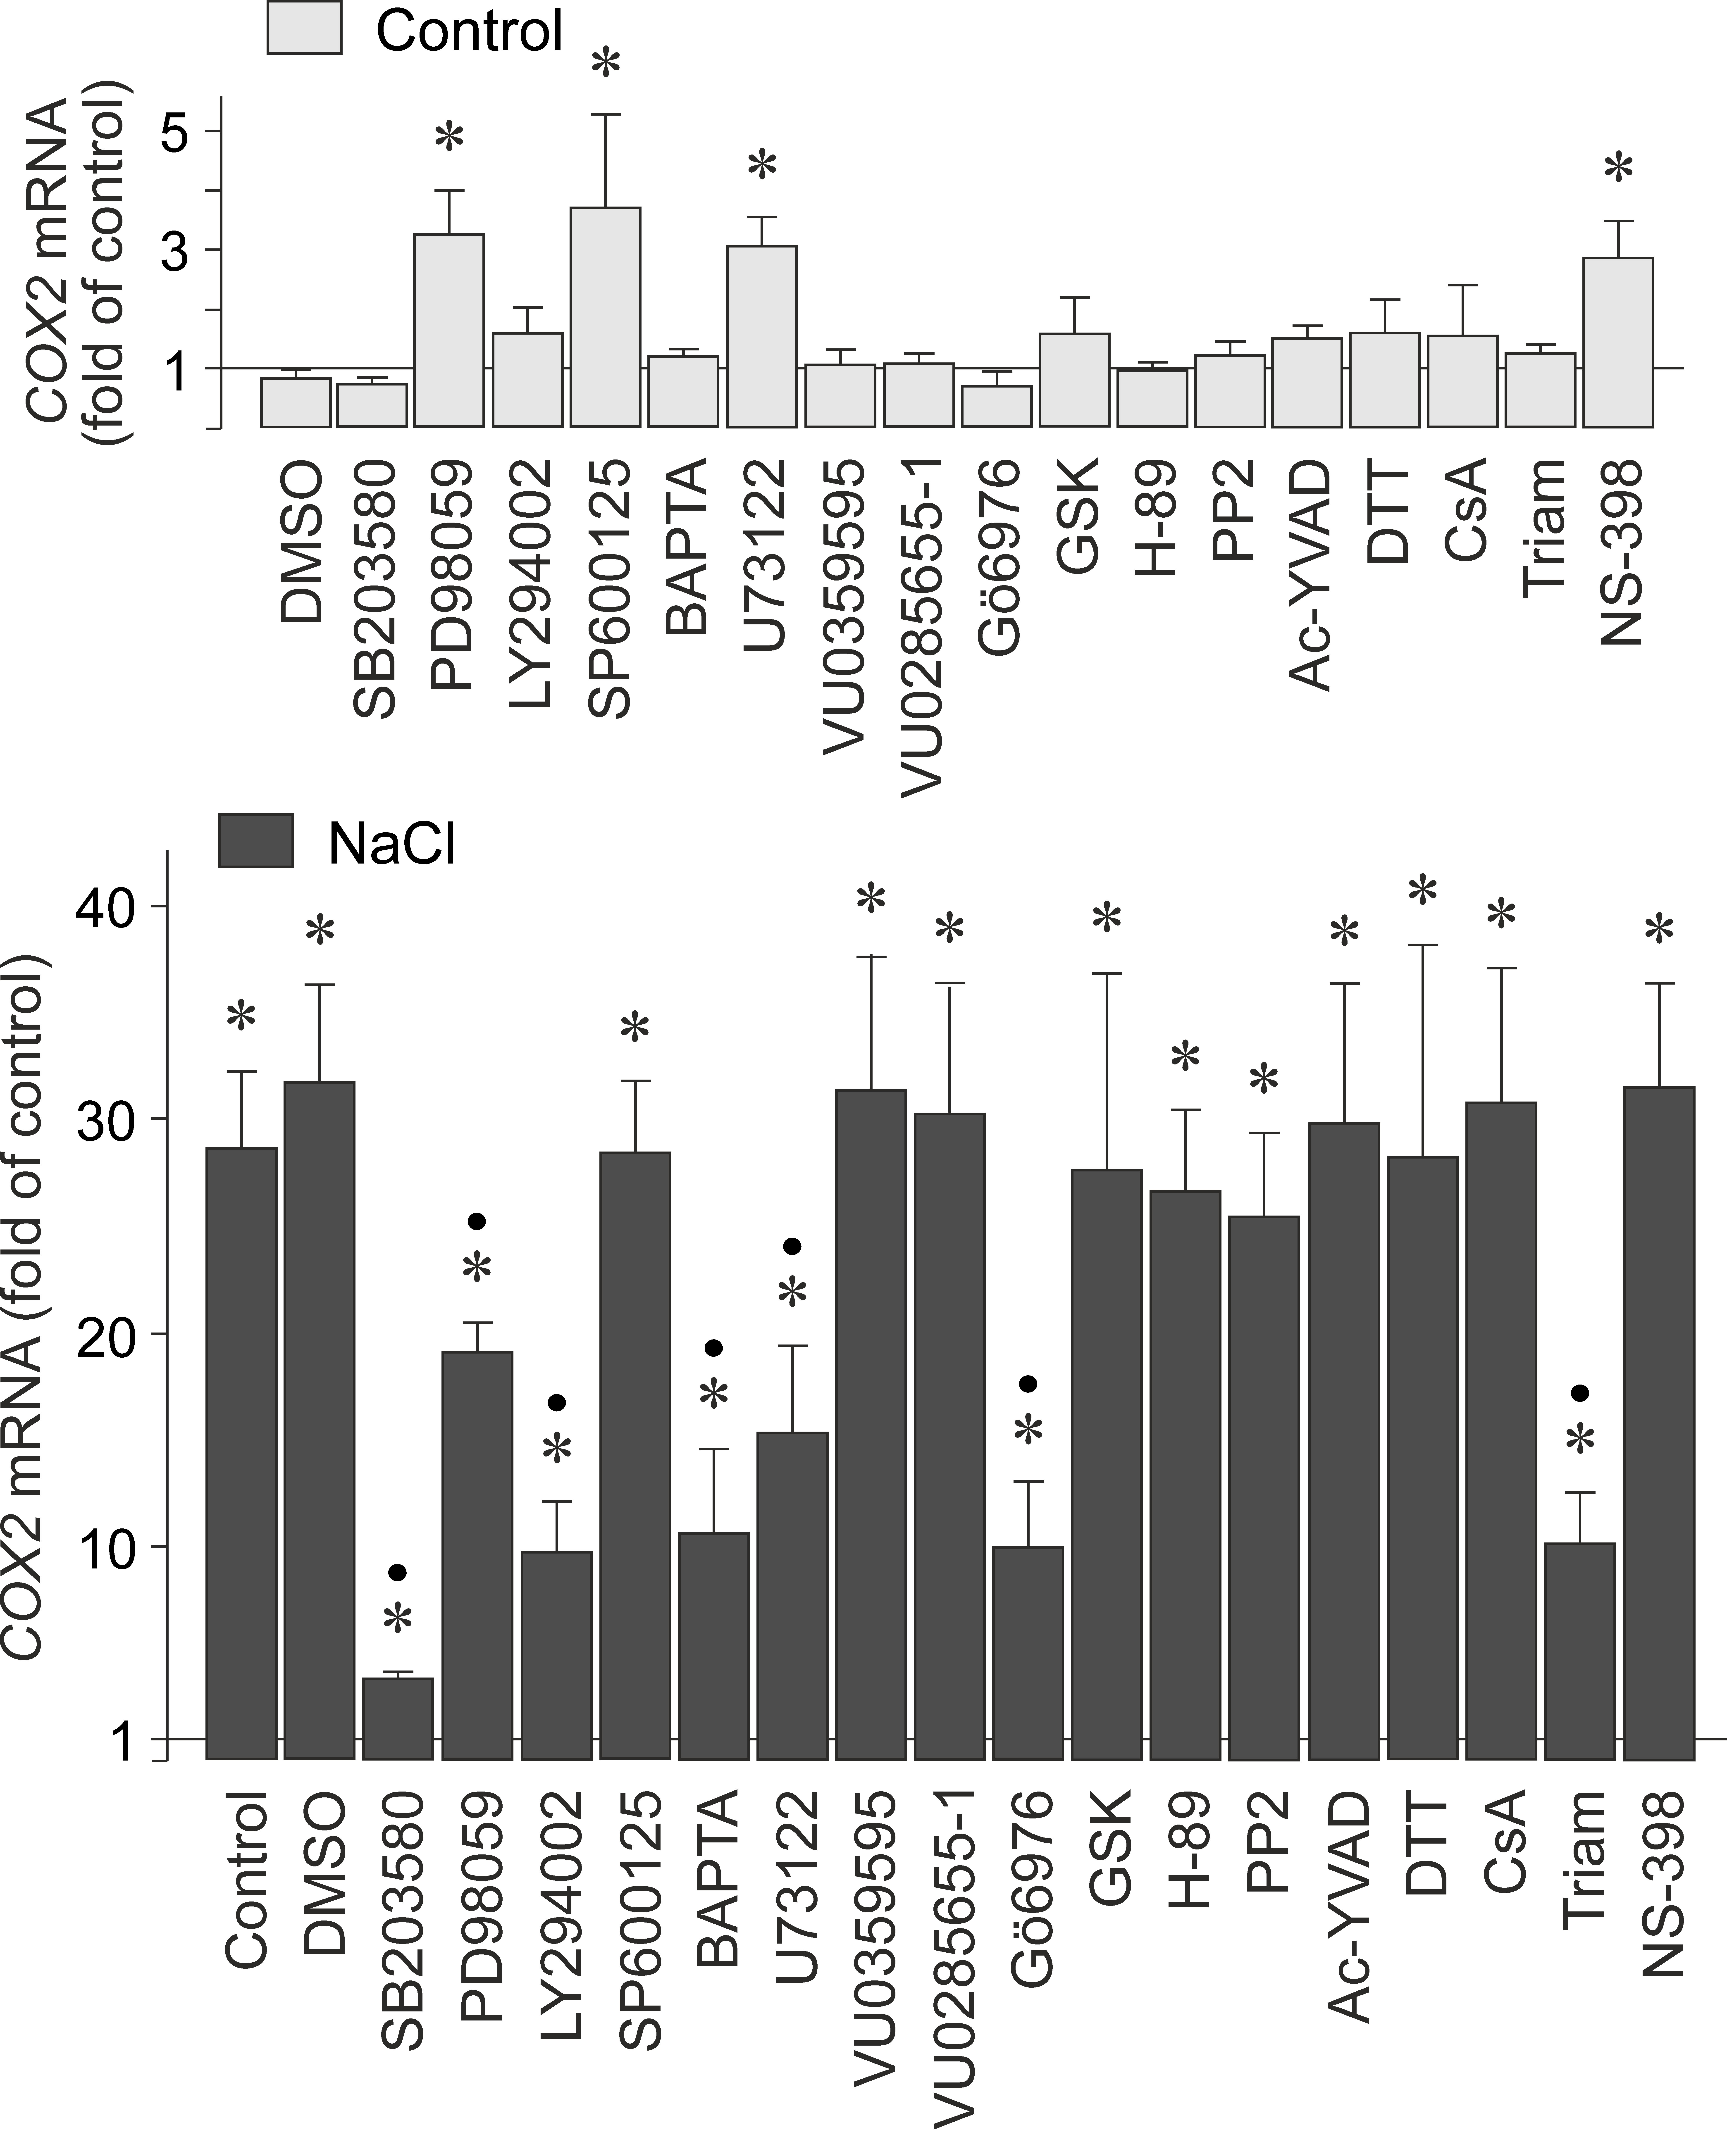
Figure 3. Intracellular signaling involved in mediating NaCl-induced expression of cyclooxygenase-2 (COX2) in retinal pigment epithelial (RPE) cells. The mRNA level was determined with real-time reverse transcription (RT)–PCR in
cells cultured 6 h in iso- (control) and hyperosmotic (+ 100 mM NaCl) media, and is expressed as folds of the unstimulated
control. The following compounds were tested: the inhibitor of p38 mitogen-activated protein kinase (p38 MAPK) activation,
SB203580 (10 µM), the inhibitor of extracellular signal-regulated kinases 1 and 2 (ERK1/2) activation, PD98059 (20 µM), the
inhibitor of phosphatidylinositol-3 kinase (PI3K)-related kinases, LY294002 (5 µM), the c-Jun NH2-terminal kinase (JNK) inhibitor SP600125 (10 µM), the cell-permeable calcium chelator BAPTA/AM (5 µM), the phospholipase
Cγ (PLCγ) inhibitor U73122 (4 µM), the phospholipase D1 (PLD1) inhibitor VU0359595 (150 nM), the phospholipase D2 (PLD2) inhibitor
VU0285655–1 (500 nM), the inhibitor of protein kinase Cα/β (PKCα/β), Gö6976 (1 µM), the serum and glucocorticoid-regulated
kinase (SGK) inhibitor GSK650394 (GSK; 1 µM), the protein kinase A inhibitor H-89 (1 µM), the inhibitor of Src tyrosine kinases,
PP2 (100 nM), the caspase-1 inhibitor Ac-YVAD-CMK (500 nM), the reducing agent dithiothreitol (DTT; 3 mM), the inhibitor of
mitochondrial permeability transition, cyclosporin A (CsA; 1 µM), the anti-inflammatory glucocorticoid triamcinolone acetonide
(Triam; 50 µM), and the COX2 antagonist NS-398 (50 µM). Each bar represents data obtained in three to 20 independent experiments
with cell lines from different donors. Each experiment was performed with cell lines from three to seven donors; in total,
cell lines from 26 different donors were used for all experiments shown. Statistically significant difference versus unstimulated
control: *p<0.05. Statistically significant difference versus NaCl control: ●p<0.05.

 Figure 3 of
Messerschmidt, Mol Vis 2019; 25:329-344.
  Figure 3 of
Messerschmidt, Mol Vis 2019; 25:329-344.