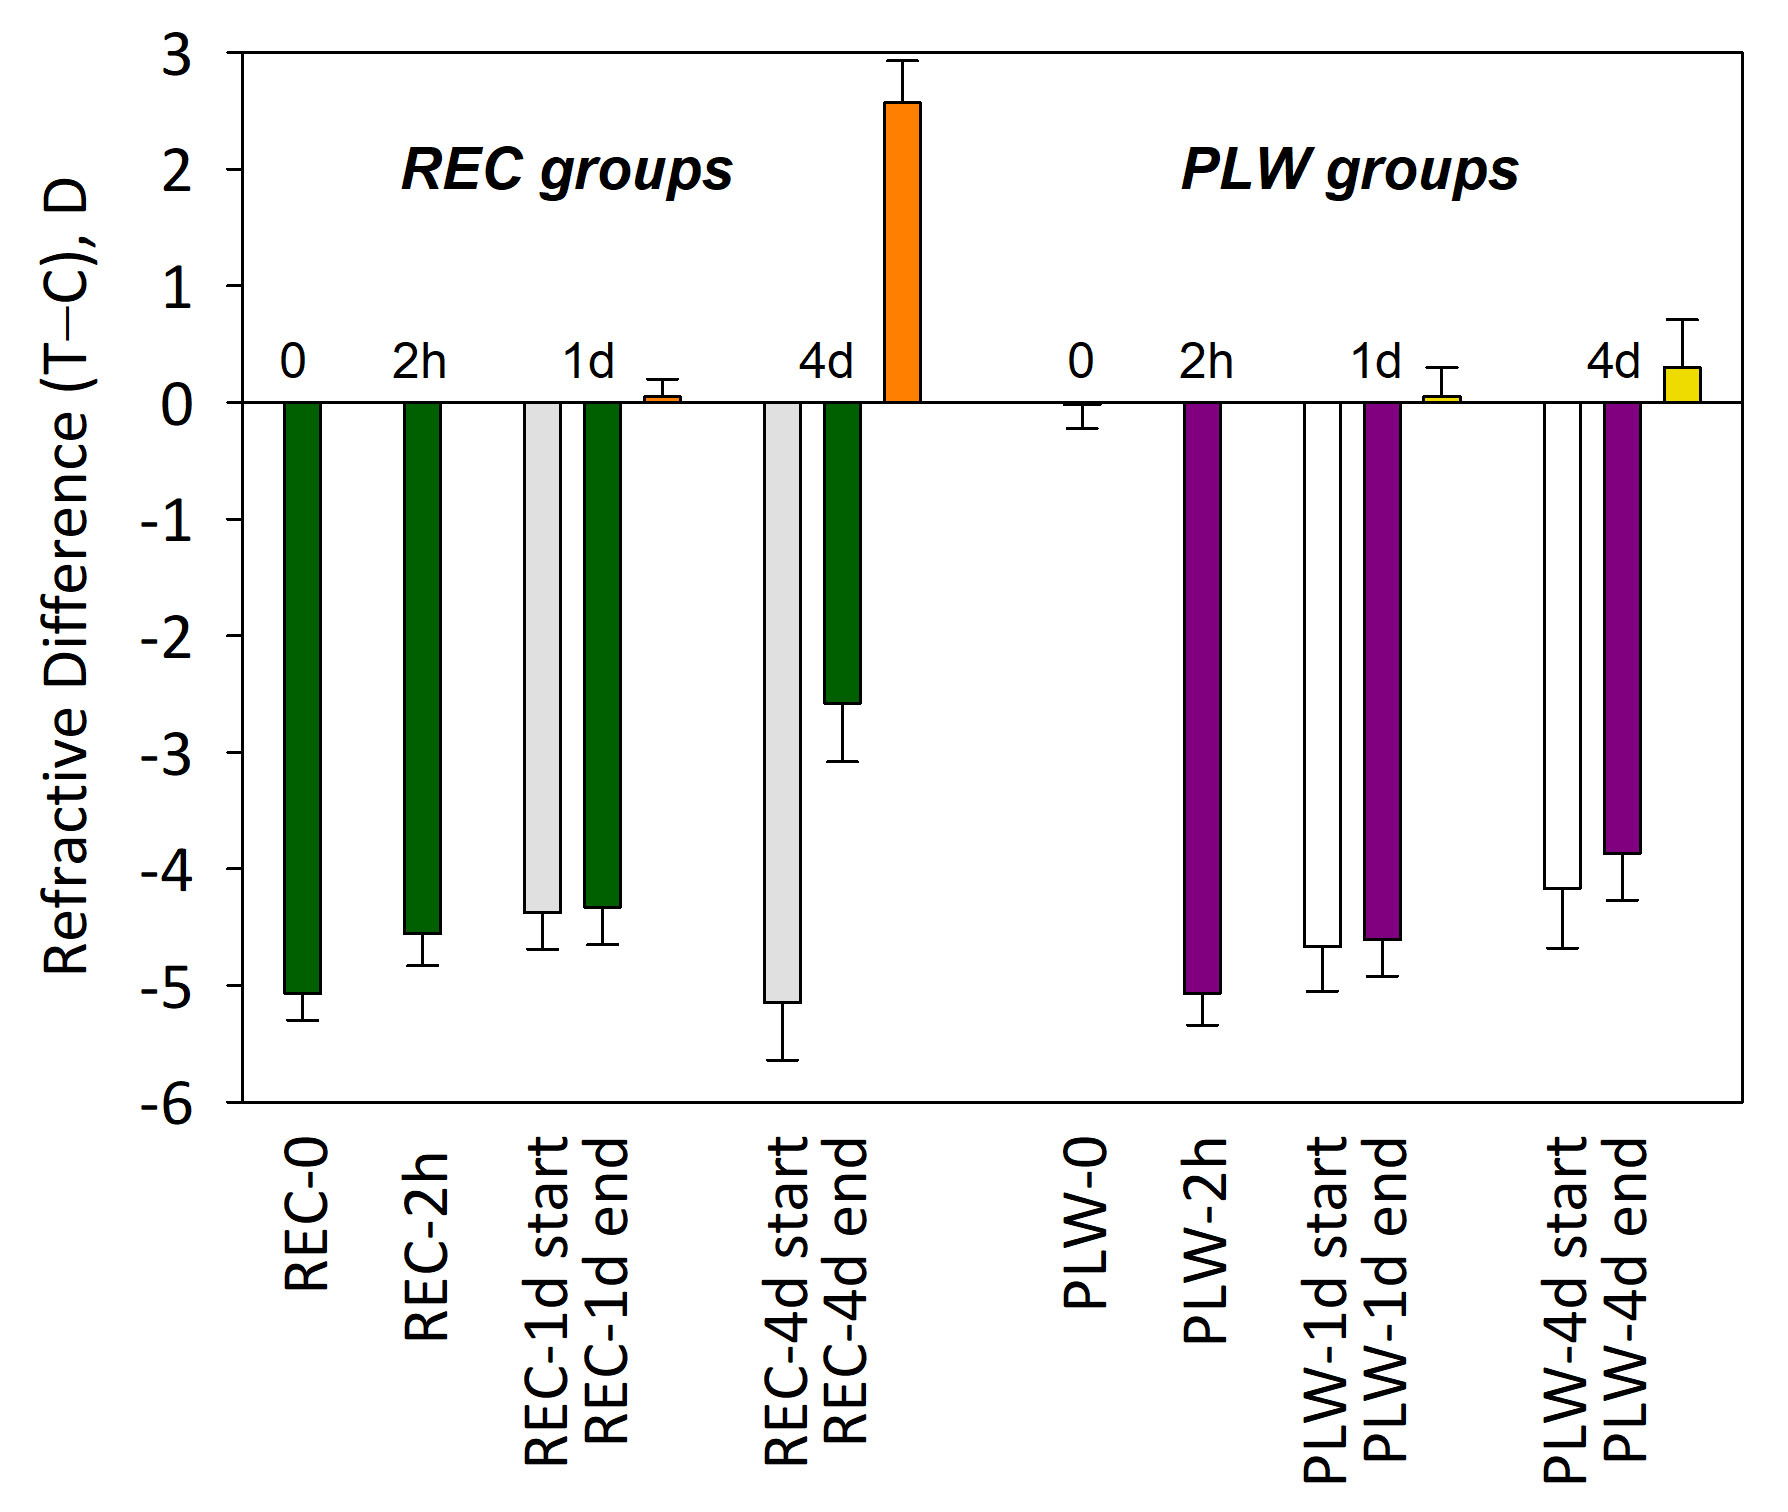
Figure 2. Refractive difference between treated and control eyes for each group (mean ± standard error of the mean [SEM]). For the recovery
(REC) groups, the dark green bars show the amount of myopia at the end of recovery. For the groups that recovered for 1 day
(REC-1d) and 4 days (REC-4d), the amount of myopia at the start of recovery is shown by the gray bars; the orange bar shows
the amount of refractive recovery. For the plus-lens wear (PLW) groups, the dark purple bars show the myopia present, while
the lens was in place, at the end of PLW. For the groups that wore a monocular +5 D lens for 1 day (PLW-1d) and 4 days (PLW-4d),
the amount of myopia of the start of PLW is shown by the open bars. The yellow bars show the refractive change (reduction
in myopia while wearing the +5 D lens) between the start and end of PLW.

 Figure 2 of
Guo, Mol Vis 2019; 25:311-328.
  Figure 2 of
Guo, Mol Vis 2019; 25:311-328.