Figure 3. Corneal thickness measurement by confocal microscopy. OD: Right eye; OS: left eye. Scan at 48 h post-blast exposure. *Control
cornea compared to blast-exposed cornea (p<0.05). Data are presented as mean ± SEM of three to four animals per group.
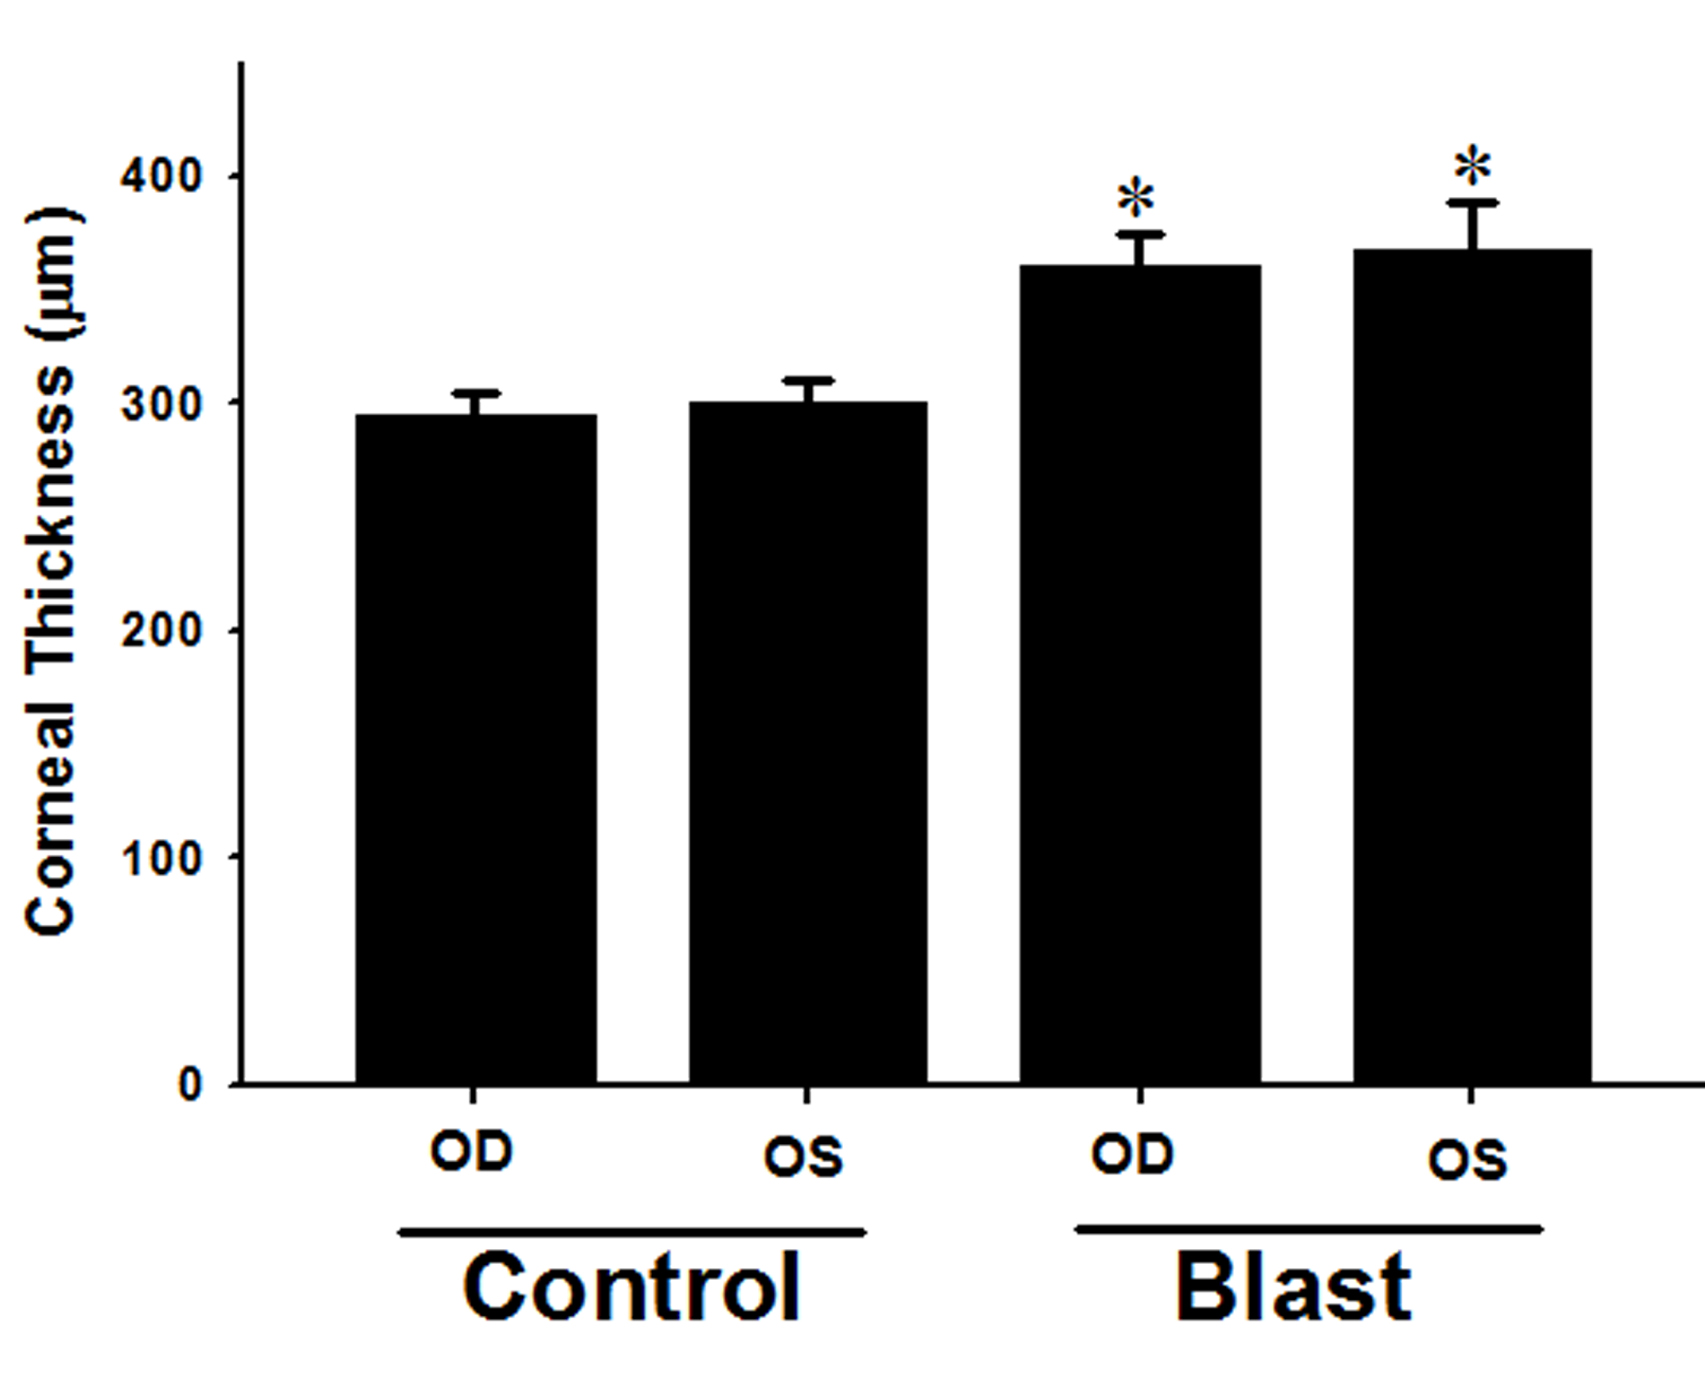
 Figure 3 of
Ríos, Mol Vis 2019; 25:283-294.
Figure 3 of
Ríos, Mol Vis 2019; 25:283-294.