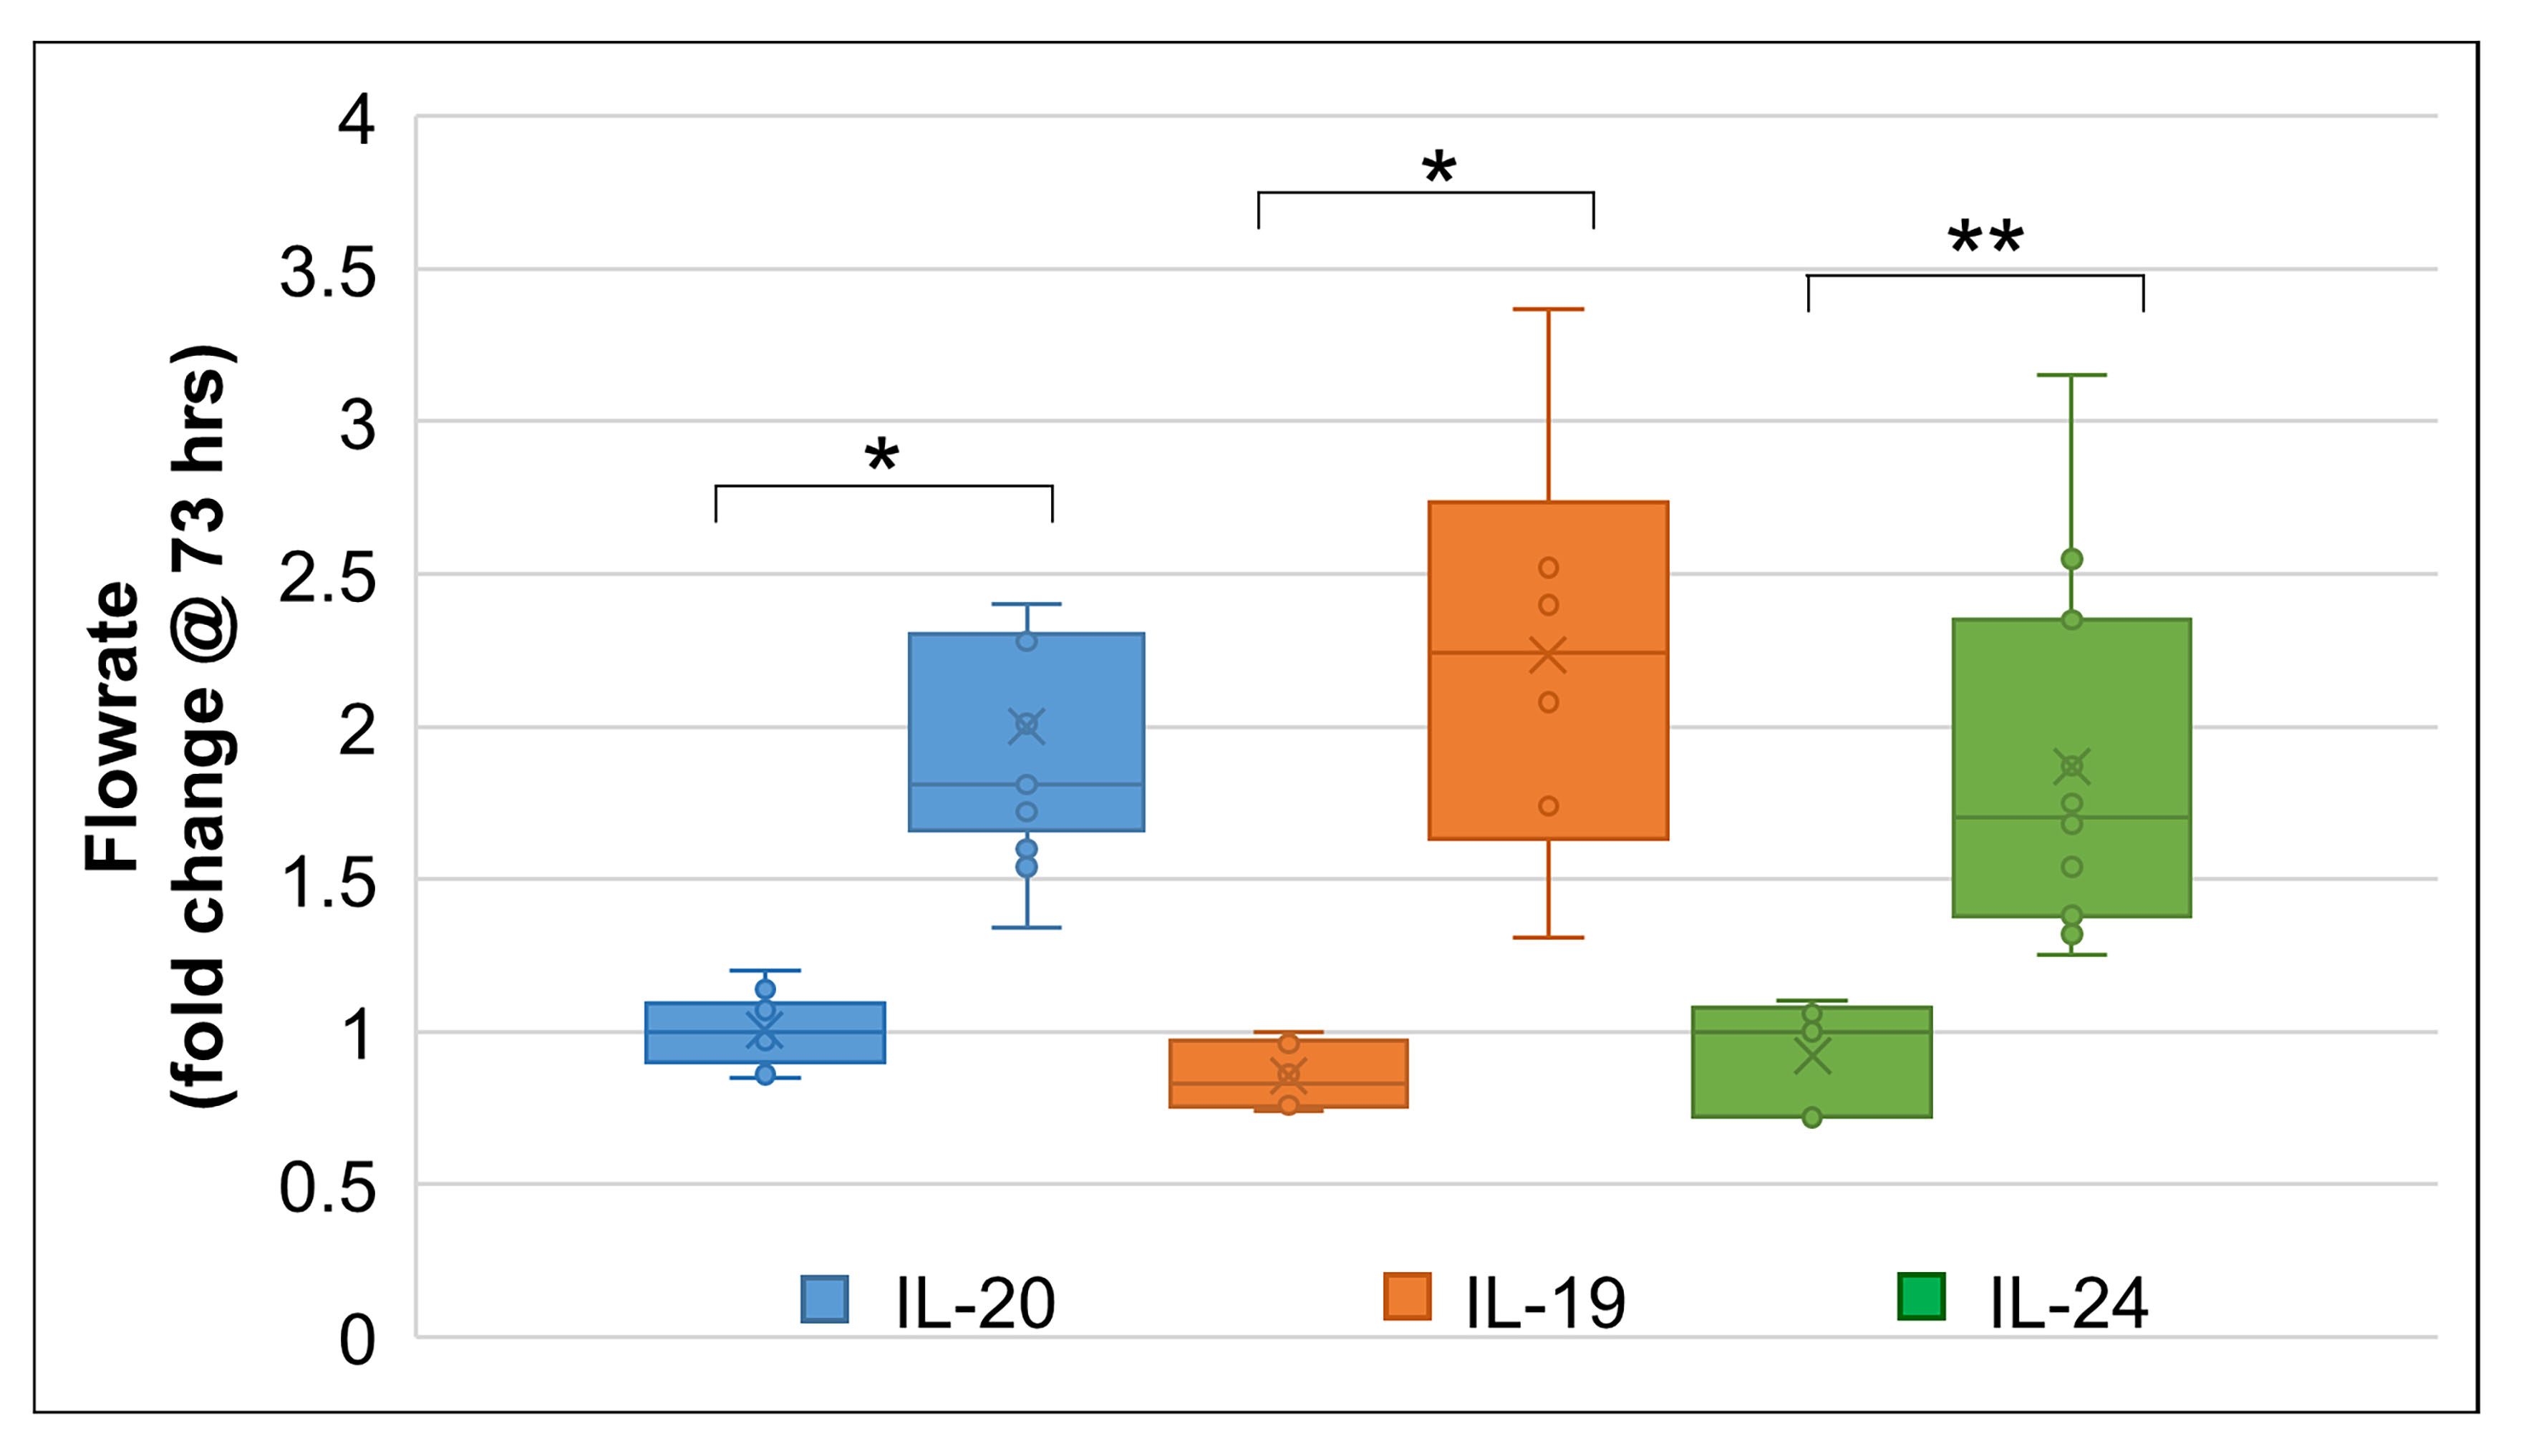
Figure 7. Analysis of the porcine flow rate data at 73 h. Comparison of non-responders and responders to interleukin-20 (IL-20) IL-20,
IL-19, and IL-24. Error bars are the standard error of the mean, the cross is the mean, and the line across the center of
the box is the median. The outlier data point for IL-20 is not shown. * p<0.001, ** p<0.01.

 Figure 7 of
Keller, Mol Vis 2019; 25:266-282.
  Figure 7 of
Keller, Mol Vis 2019; 25:266-282.