Figure 7. Effect of DEX on MFG-E8 and CD36 expression. A: qPCR analyses showed that DEX treatment increased the expression of MFGE8 mRNA at days 2, 4, and 5 compared to the no trt controls. The increases were statistically significant (*) at p< (0.05) compared
to the no trt controls. The mRNA levels were normalized to the no trt group. All five HTM cell strains (N27TM-2, N27TM-4,
N27TM-5, N27TM-6, and N25TM-8) were used for the qPCR analyses; n=5. B: qPCR indicated that DEX did not have any statistically significant effect on mRNA levels for CD36 compared to the no trt HTM cells at day 0. The mRNA levels were normalized to the no trt group. All five HTM cell strains
described in (A) were used for the qPCR analyses; n=5. C: FACS analyses of CD36 levels on HTM cells (N25TM-8 and N25TM-10) in the presence of DEX or a vehicle were done in duplicate.
Cell surface CD36 levels did not change significantly in response to DEX; n=2. All data represent the mean ± SEM.
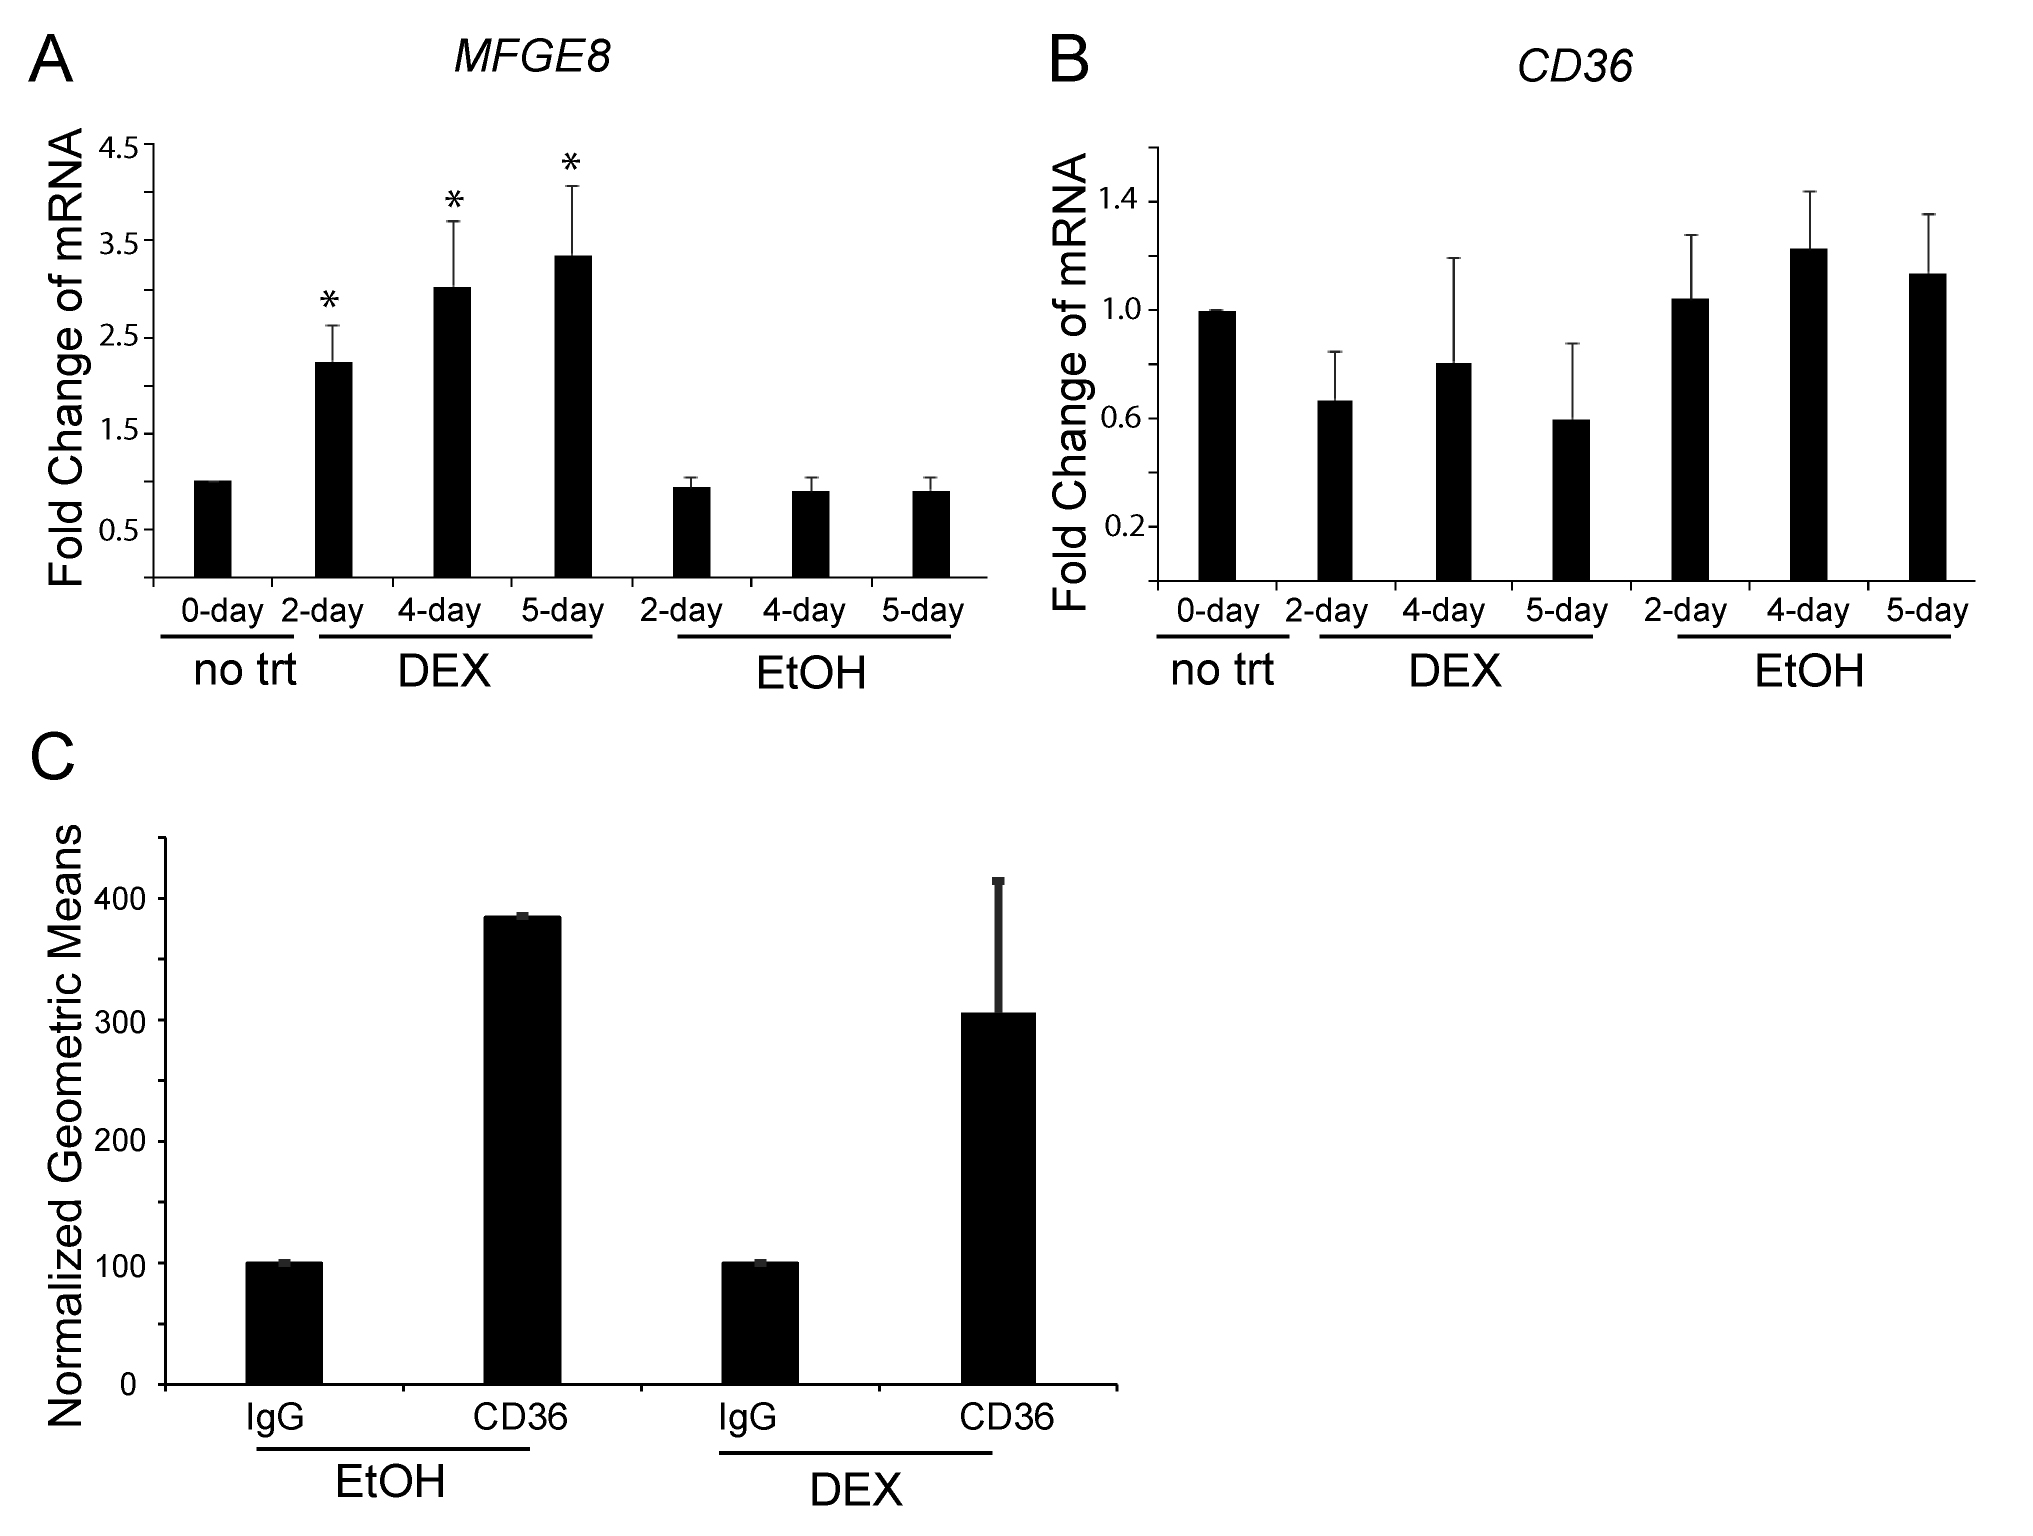
 Figure 7 of
Faralli, Mol Vis 2019; 25:237-254.
Figure 7 of
Faralli, Mol Vis 2019; 25:237-254.