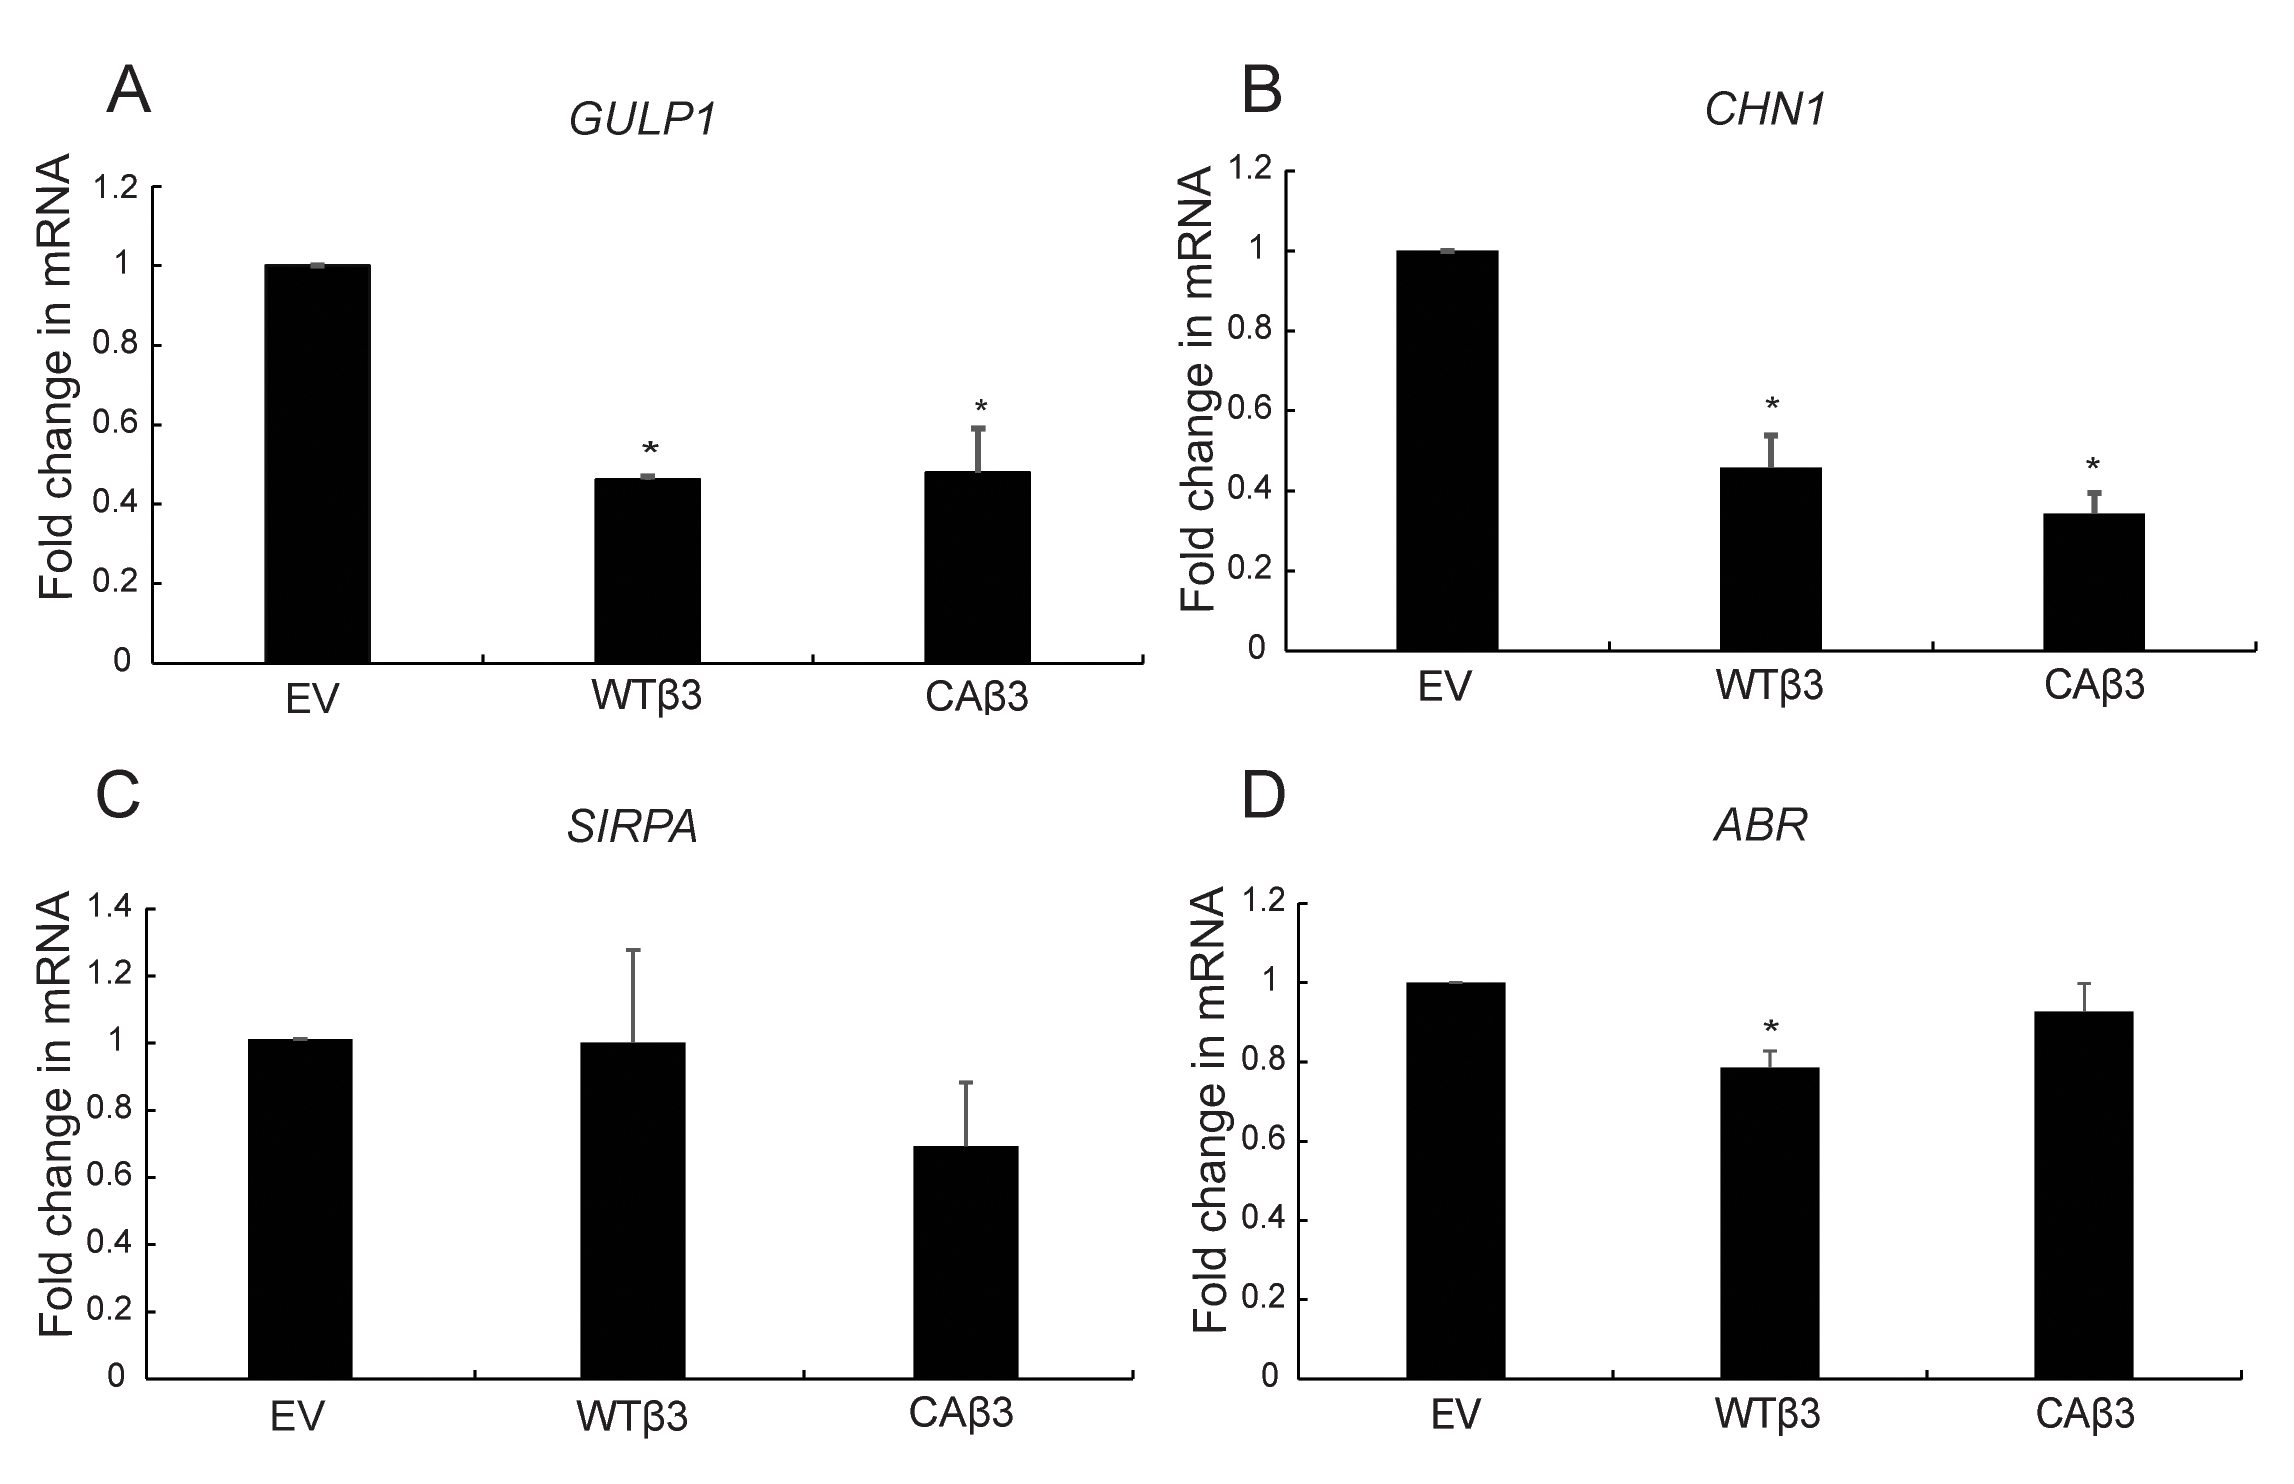
Figure 6. Effect of αvβ3 integrin expression on
GULP1, CHN1, ABR, and SIRPA mRNA expression.
qPCR analyses of
GULP1, CHN1, SIRPA, and
ABR mRNA levels were done on stable TM-1 cell lines overexpressing the WT β3 integrin subunit or a CA β3 integrin subunit [
11]. A cell line transduced with an empty vector (EV) was used as a control. Analyses were done in triplicate in three independent
experiments; n=3. The decreases in
GULP1,
CHN1, and
ABR mRNA levels were statistically significant (*) at p<0.05 compared to the cells transduced with the EV. All data were normalized
to the mRNA levels observed in EV cells. Data represent the mean ± SEM.
 Figure 6 of
Faralli, Mol Vis 2019; 25:237-254.
Figure 6 of
Faralli, Mol Vis 2019; 25:237-254.