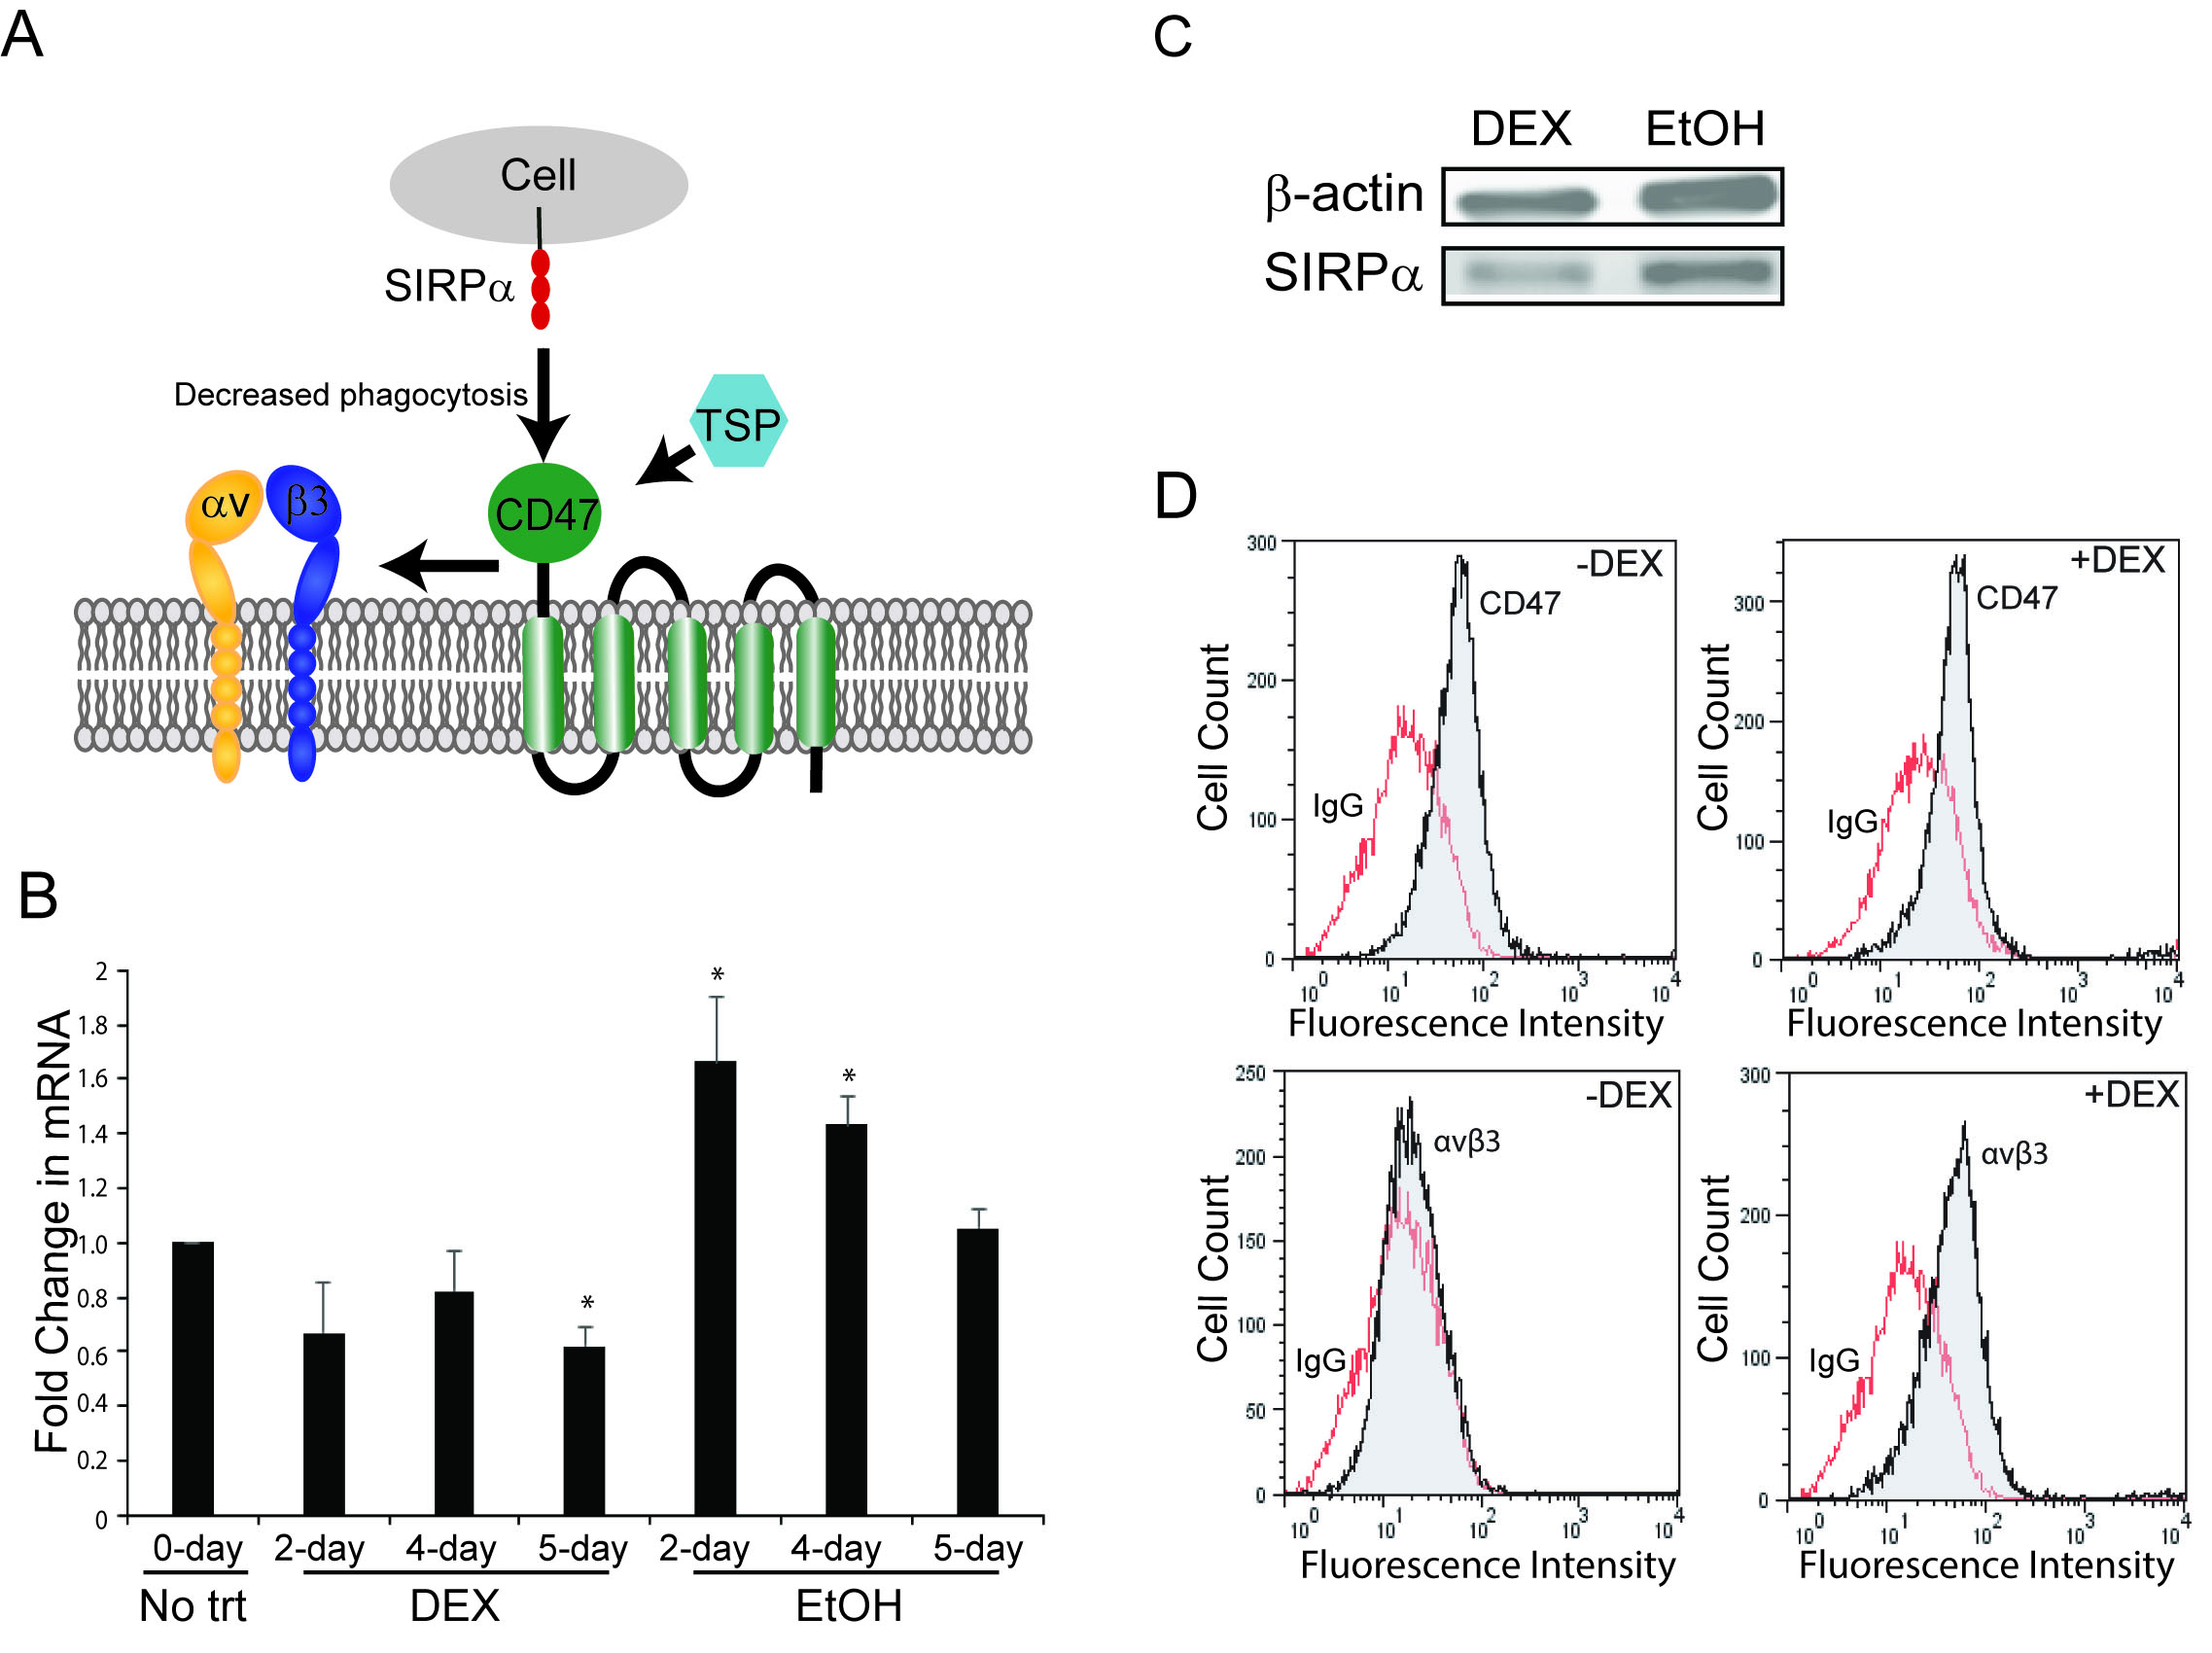
Figure 5. Effect of DEX on
CD47 and
SIRPA expression.
A: Schematic diagram showing that CD47 can interact with αvβ3 integrin on the same cell or with SIRPα on an adjacent cell.
CD47 can also bind thrombospondin-1 (TSP), which promotes an interaction between CD47 and αvβ3 integrin and triggers αvβ3
integrin signaling [
36,
37].
B: qPCR analyses showed that DEX treatment caused the downregulation of
SIRPA mRNA by day 5 of treatment compared to the no trt group at day 0. In contrast, EtOH-treated controls showed an increase in
mRNA levels starting on day 2 of the treatment. All these changes were statistically significant (*) at p<0.05 compared to
the no trt cells. The mRNA levels were normalized to the no trt group. All five HTM cell strains (N27TM-2, N27TM-4, N27TM-5,
N27TM-6, and N25TM-8) were used for the qPCR analyses; n=5.
C: Western blot analyses showed that protein levels of SIRPα were decreased by DEX compared to EtOH-treated controls. The figure
is a representative blot done on cell lysates from three separate experiments using the N25TM-8 cell strain. β-actin was used
as a loading control. Equal amounts of protein from the DEX- and EtOH-treated cell lysates were loaded; n=3.
D: FACS analyses of CD47 and αvβ3 integrin levels in HTM cells (N27TM-4) in the presence of DEX or a vehicle. Analyses were
done in duplicate and verified in two independent experiments using both N27TM-2 and N27TM-4 cells. DEX caused an increase
in αvβ3 integrin levels but not CD47; n=2.
 Figure 5 of
Faralli, Mol Vis 2019; 25:237-254.
Figure 5 of
Faralli, Mol Vis 2019; 25:237-254.