Figure 4. Knock down of GULP1 expression inhibits phagocytosis. A: qPCR analyses showed that DEX treatment caused the downregulation of GULP1 mRNA by day 2 of treatment compared to the no trt and the EtOH-treated controls. The decrease on all three days was statistically
significant compared to the no trt cells and EtOH-treated cells (*p<0.05). Data are presented as the mean ± SEM. The mRNA
levels were normalized to the no trt group. All five HTM cell strains (N27TM-2, N27TM-4, N27TM-5, N27TM-6, and N25TM-8) were
used for the qPCR analyses; n=5. B: Western blot analyses showed that protein levels of GULP1 were decreased in DEX-treated cells compared to EtOH-treated controls.
The figure is a representative blot done on HTM (N25TM-8) cell lysates from three separate experiments; n=3. β-actin was used
as a loading control. Equal amounts of protein from the DEX- and EtOH-treated cell lysates were loaded. C: Fluorescence micrographs showed a decrease in the uptake of pHrodo™ bioparticles (red) in TM-1 cells transfected with GULP1 and ITGB5 siRNA compared to NT siRNA-transfected cells. Cells were counterstained with CellMask Green to visualize the cells. White
arrows point out that many cells transfected with GULP1 or ITGB5 siRNAs have engulfed fewer bioparticles/per cell then NT siRNA-transfected cells. D: Quantification of the number of cells that took up pHrodo™ bioparticles in TM-1 cells transfected with GULP1 siRNA (n=1610 cells) or ITGB5 siRNA (n=1605 cells) showed a statistically significant (*) reduction in phagocytosis at p<0.05 compared to cultures transfected
with NT siRNA (n=1888 cells). Data are the percent positive ± SEM of three independent experiments.
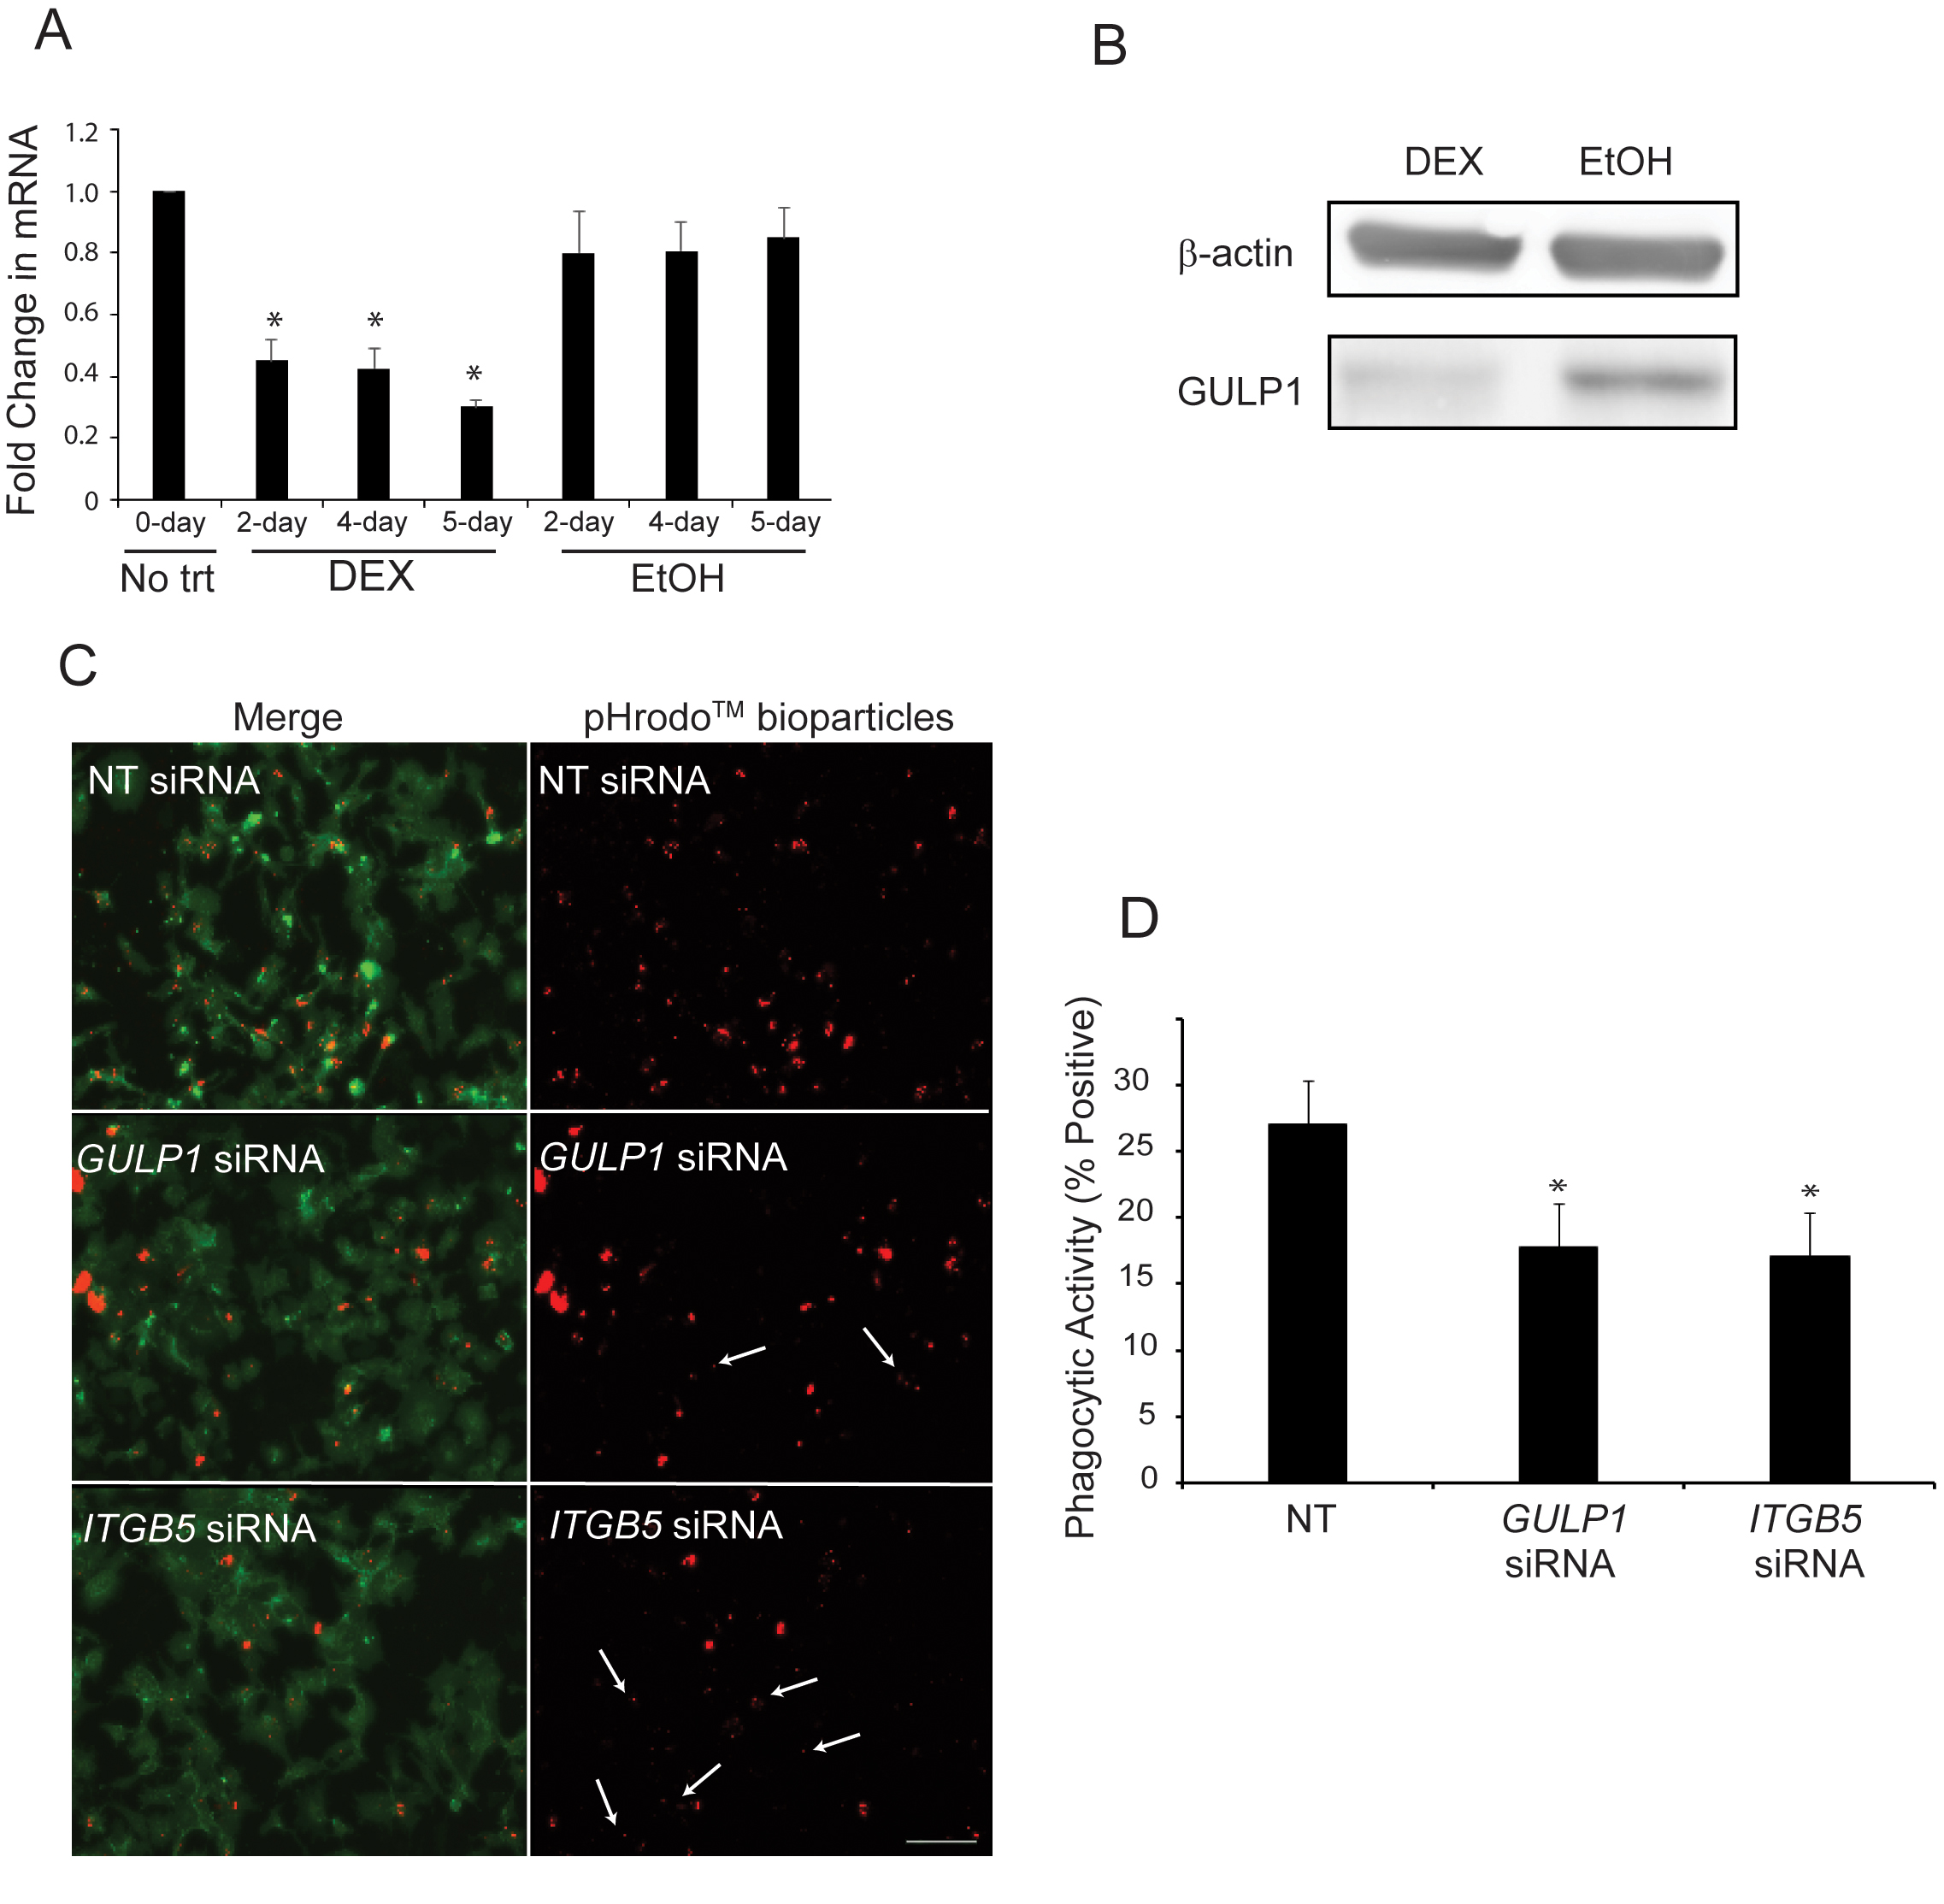
 Figure 4 of
Faralli, Mol Vis 2019; 25:237-254.
Figure 4 of
Faralli, Mol Vis 2019; 25:237-254.