Figure 8. Scatterplots of correlation between iris transillumination and expression of Gpnmb and Stc1 among BXD strains. Each spot represents each BXD strain or their parental strain. There are statistically significant negative
correlations between the iris transillumination score and the expression of Gpnmb (A) and Stc1 (B; p<0.0005).
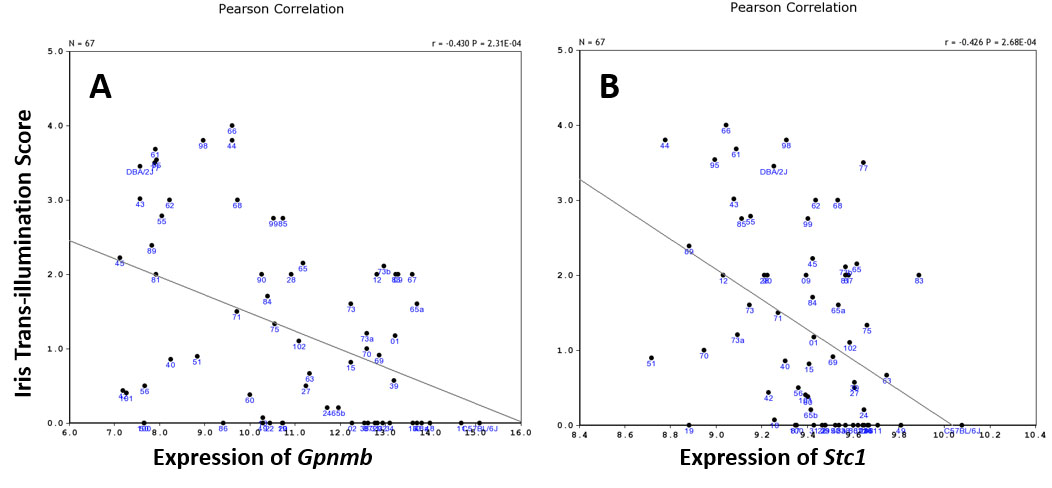
 Figure 8 of
Lu, Mol Vis 2019; 25:222-236.
Figure 8 of
Lu, Mol Vis 2019; 25:222-236.