Figure 5. Expression level of Stc1 in the retina of the B6 and D2 parental strains, F1 hybrids, and 75 BXD strains. The expression value for each sample was
calculated using the rank-invariant normalization method through BeadStudio software, and then renormalized using modified
Z-scores. The x-axis denotes the strain; the y-axis denotes the expression of the strain mean on a log2 scale. Each bar represents
the mean expression value ± standard error of the mean (SEM).
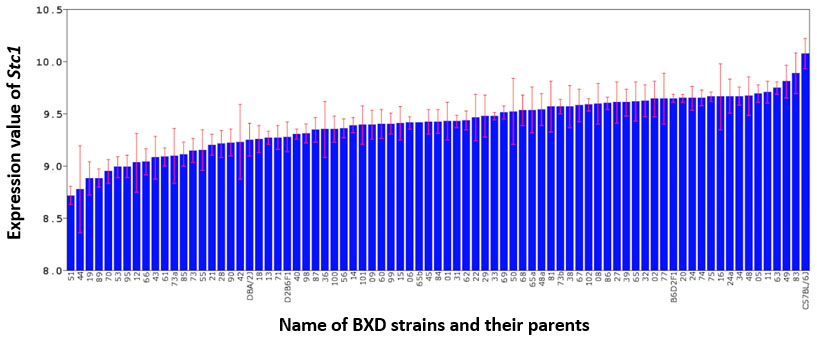
 Figure 5 of
Lu, Mol Vis 2019; 25:222-236.
Figure 5 of
Lu, Mol Vis 2019; 25:222-236.