Figure 4. mRNA expression of Gpnmb and Stc1 in the retina of D2 mice. Each bar shows the mean relative expression value ± standard deviation (SD) using the ΔΔ cT method.
The blue bar (left for each gene) shows the expression level for 2- to 3-month-old D2 mice, and the orange bar (right for
each gene) shows the expression level for 6- to 7-month-old D2 mice. The y-axis denotes the fold change in the Gpnmb and Stc1 genes relative to 2-month-old D2 mice.
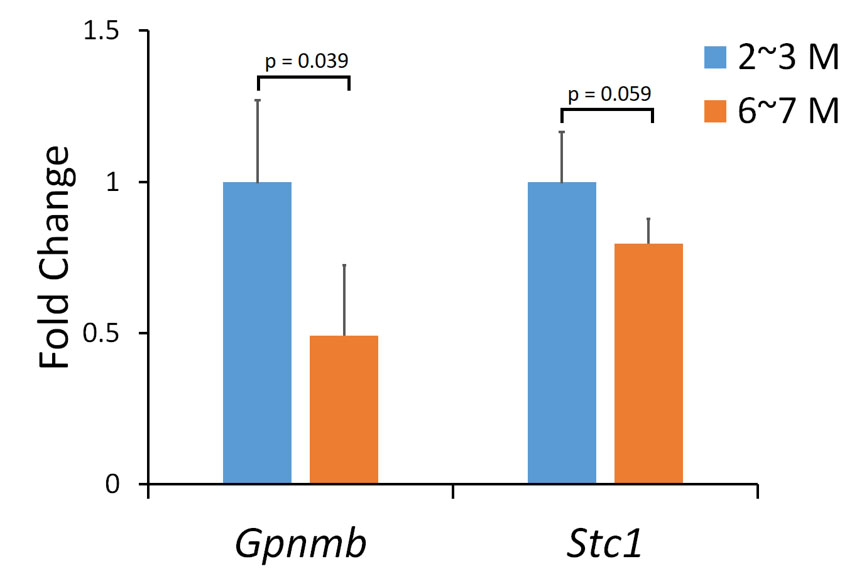
 Figure 4 of
Lu, Mol Vis 2019; 25:222-236.
Figure 4 of
Lu, Mol Vis 2019; 25:222-236.