Figure 3. Scatterplots of Gpnmb and Stc1 expression across multiple different tissues. Each spot represents one tissue. The abbreviations for each tissue are listed
in Appendix 2. There is a statistically significant positive correlation between Gpnmb and Stc1 expression (rho=0.536, p=0.00406, n=26).
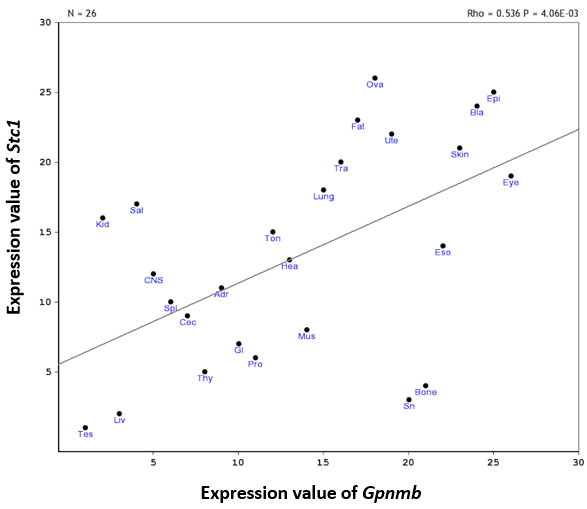
 Figure 3 of
Lu, Mol Vis 2019; 25:222-236.
Figure 3 of
Lu, Mol Vis 2019; 25:222-236.