Figure 2. Genetic mapping of Gpnmb. A statistically significant expression quantitative trait locus (eQTL) was found at chromosome 6, which is within 1 Mb of
the location of the Gpnmb gene itself (triangle), thus indicating that it is a cis-eQTL. The upper x-axis shows the chromosome, the lower x-axis shows the location in megabases, the left y-axis provides the
likelihood ratio statistic (LRS) score in blue, and the right y-axis provides the additive effect. The red and green lines
show the effect of the D or B allele on trait values, respectively. The pink (upper) horizontal line across the plot indicates
the threshold for genome-wide statistical significance (p<0.05), and the gray (lower) horizontal line indicates a suggestive
threshold (p<0.63).
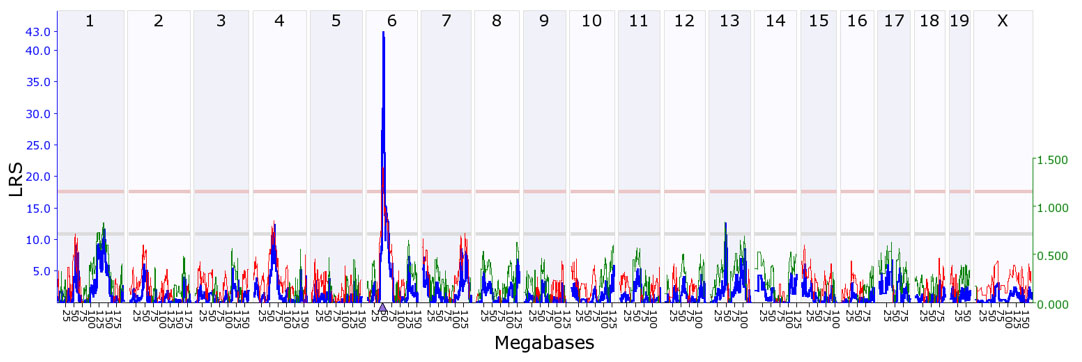
 Figure 2 of
Lu, Mol Vis 2019; 25:222-236.
Figure 2 of
Lu, Mol Vis 2019; 25:222-236.