Figure 1. Distribution of mutations in RB1 identified in this study. Gross deletions are represented as black lines. The underlined mutations are two missense novel
mutations. Splicing mutations are indicated in squares. Nonsense mutations are above the coding sequence, while frameshift
mutations are below.
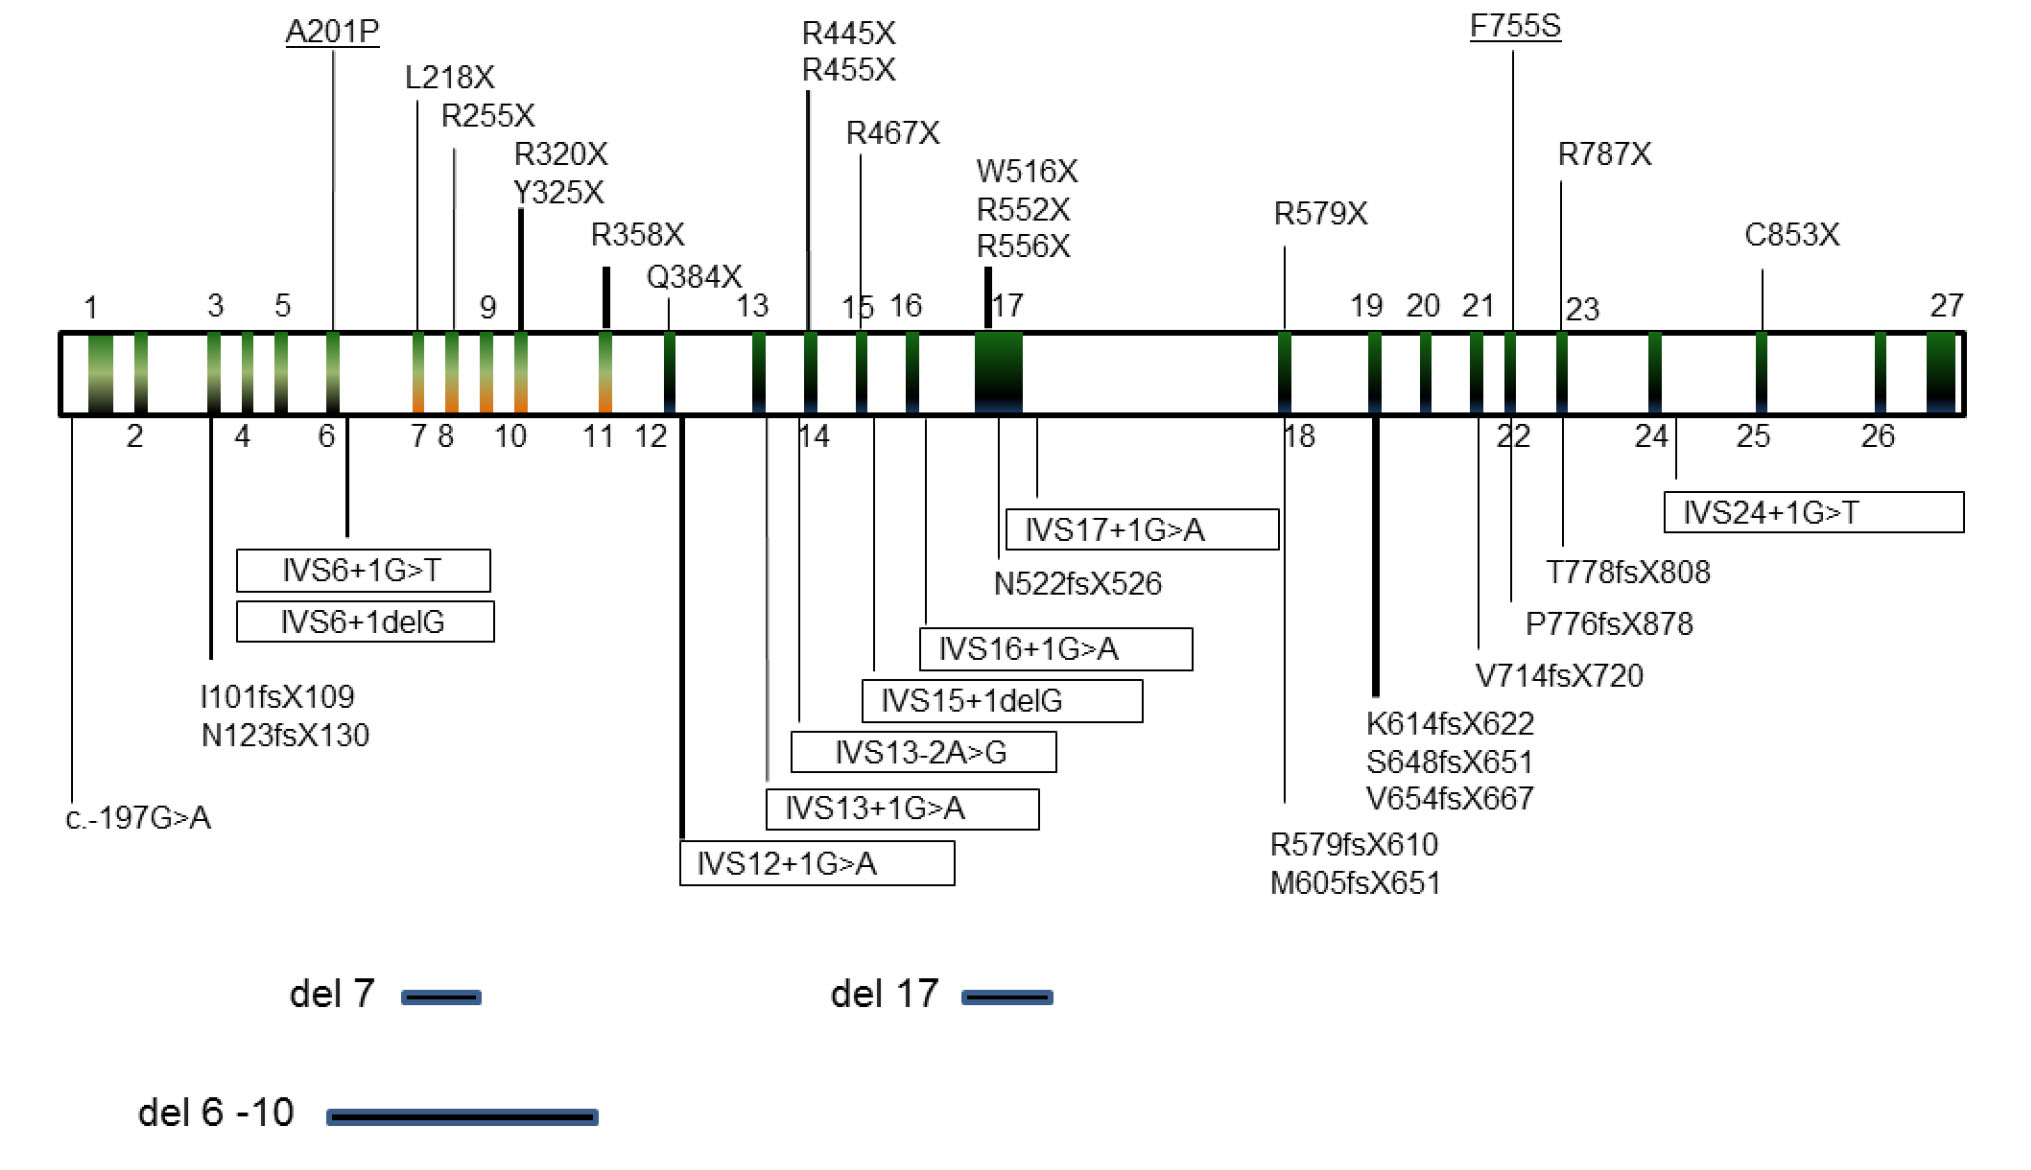
 Figure 1 of
Kiet, Mol Vis 2019; 25:215-221.
Figure 1 of
Kiet, Mol Vis 2019; 25:215-221.