Figure 2. Predicted RNA secondary structures. The top panels show RNA folding for exon 5 only in wild-type (WT) predictions compared
to those for variant 1 (V1), variant 2 (V2), and variant 3 (V3). By contrast, the bottom panels show RNA folding for full-length
coding sequences for all four RNAs. The Gibbs free energy values (ΔG) for each prediction are indicated in units of kcal mol−1. The arrows represent the location of the three OPN1LW gene variants.
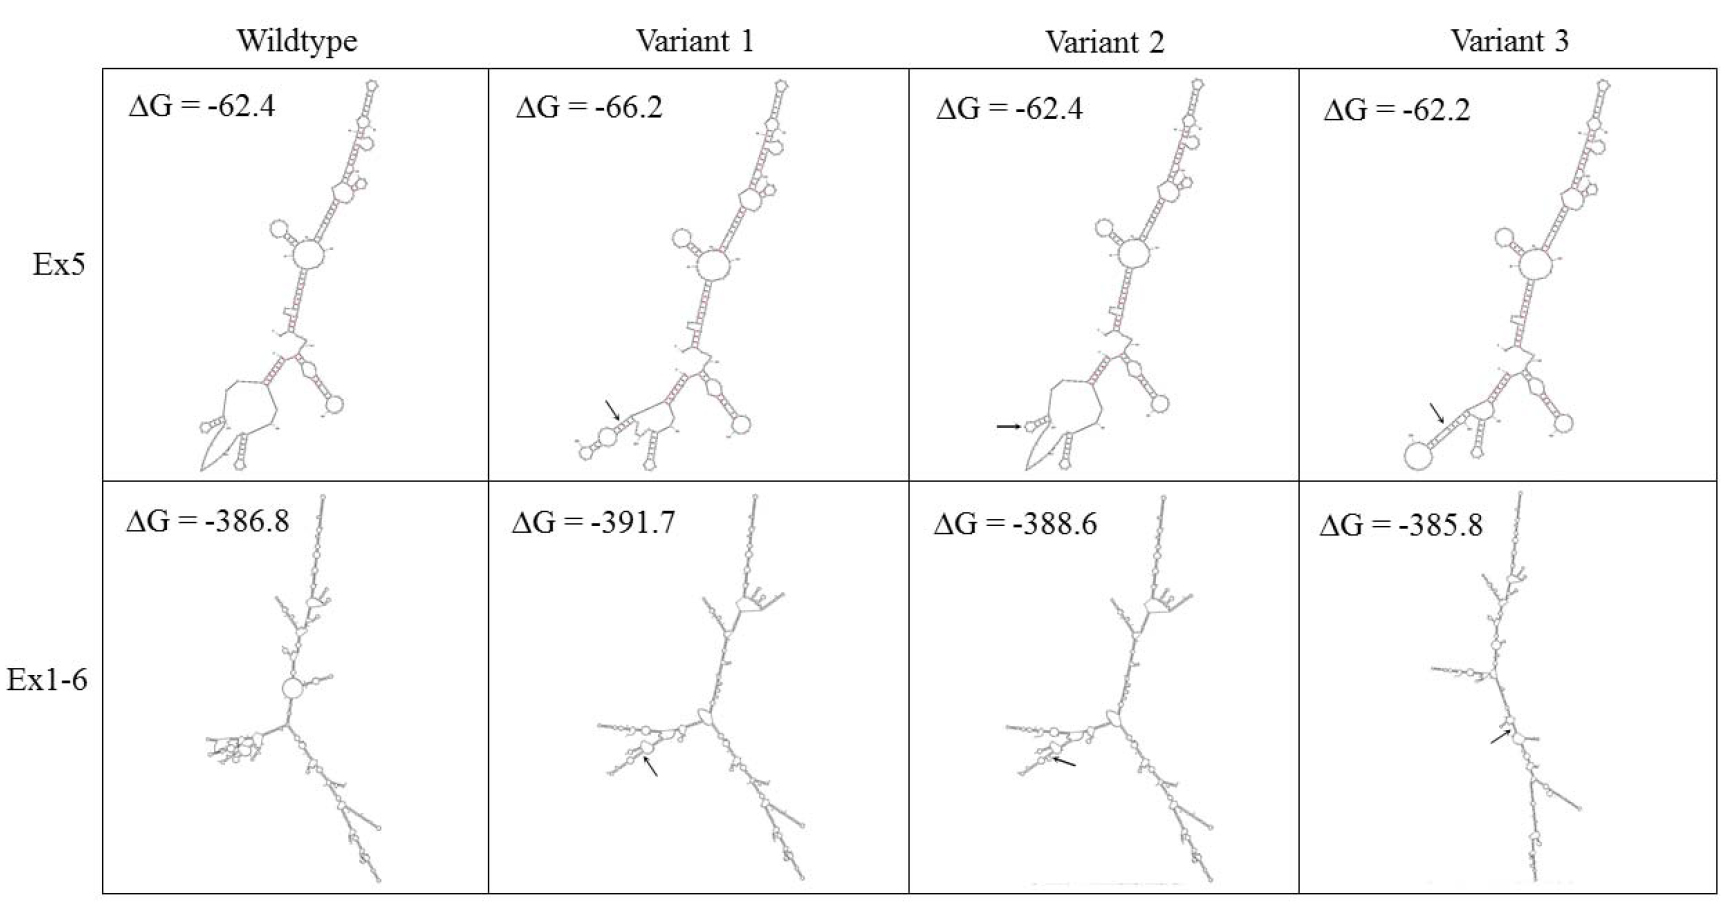
 Figure 2 of
Mountford, Mol Vis 2019; 25:183-193.
Figure 2 of
Mountford, Mol Vis 2019; 25:183-193.