Figure 1. OPN1LW gene transcripts expressed in transiently transfected human embryonic kidney (HEK293T) cells. A: Relative expression (RE) levels of unspliced transcripts determined by qPCR across the following boundaries: exon 4 – intron
4; intron 4 – exon 5; exon 5 – intron 5; and intron 5 – exon 6. B: Relative levels of spliced OPN1LW gene transcripts, measured by qPCR, using primer sets that generate amplicons form exon 4 – exon 5 and exon 5 – exon 6. In
all cases, the RE values represent OPN1LW mRNA expression normalized to the geometric mean of two internal control genes, RPL13A and EF1A1. Wild-type (WT), black; variant 1 (V1), white; variant 2 (V2), gray; variant 3 (V3), hatched. * and ** denote statistical
significance at 1% and 5% probability levels, respectively.
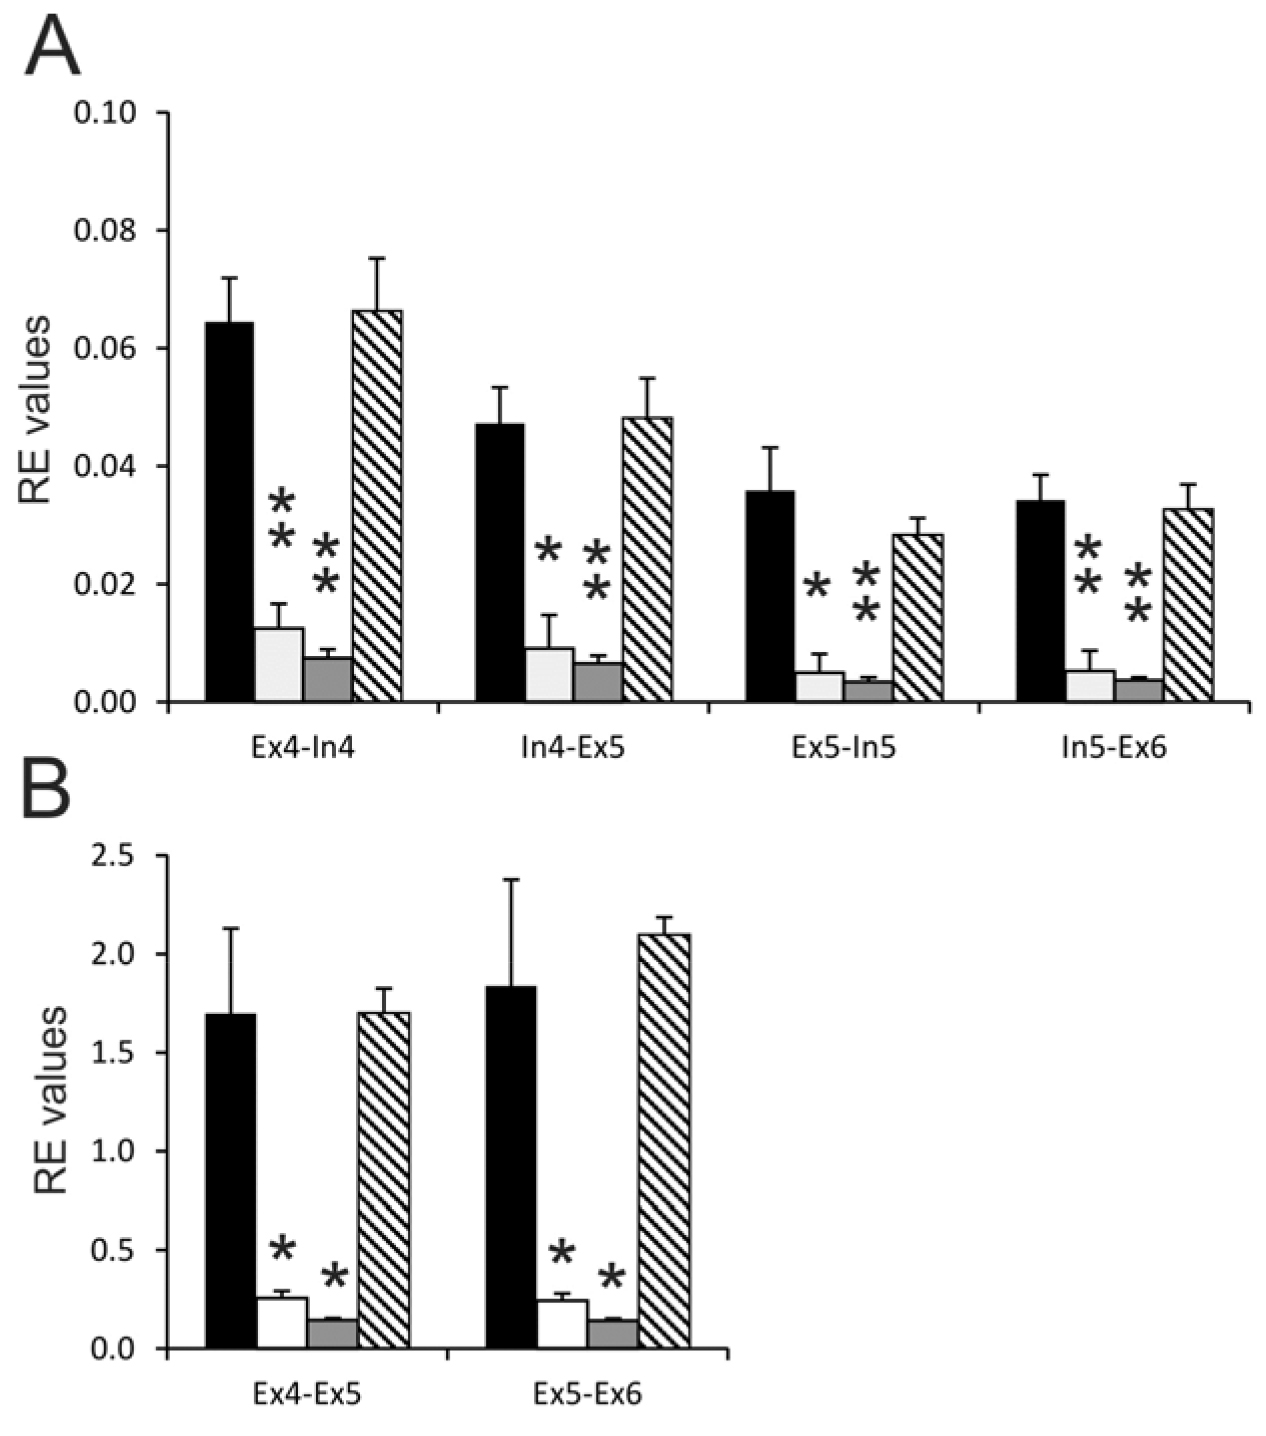
 Figure 1 of
Mountford, Mol Vis 2019; 25:183-193.
Figure 1 of
Mountford, Mol Vis 2019; 25:183-193.