Figure 1. Antibody microarrays customized. A: Specific device for analyzing four microarrays simultaneously. B,C: Spotting pattern for the 24-subarray format. D: Representative image of the arrays showing the distribution of the standard calibration curve and samples. Only one microarray
slide contains a standard calibration curve (left column) and the fluorescence acquisition for 16 tear samples (Microarray
1). Other slices (Microarrays 2–4) show the fluorescence for 24 tear samples. Fluorescence scans of the microarray multiplex
assays were acquired at 633 nm.
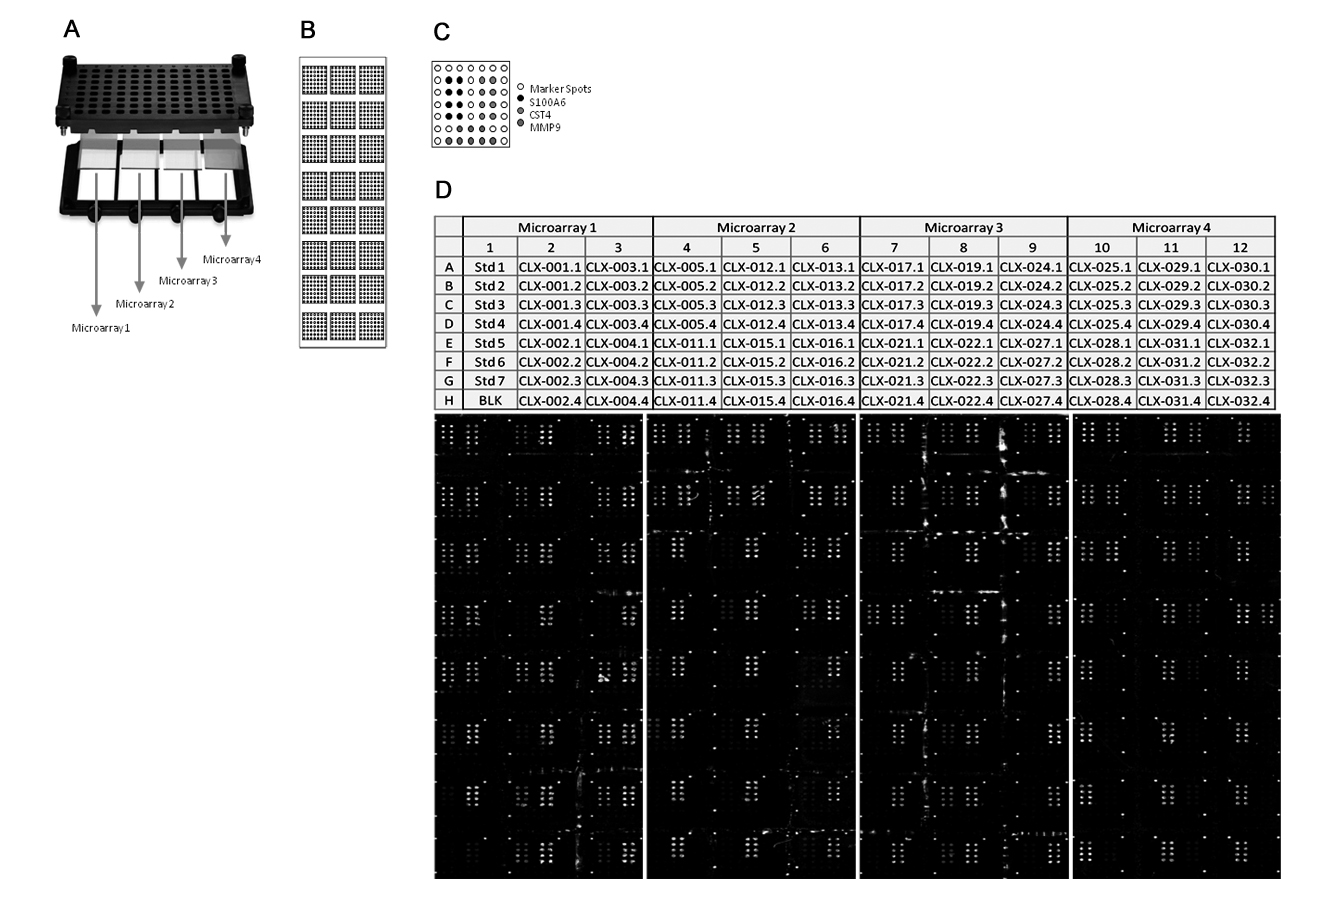
 Figure 1 of
Recalde, Mol Vis 2019; 25:12-21.
Figure 1 of
Recalde, Mol Vis 2019; 25:12-21.