Figure 3. Effects of FH on m-calpain in the lens. A: Gene expression of m-calpain was analyzed using real-time polymerase chain reaction, and then normalized to glyceraldehyde
3-phosphated dehydrogenase (GAPDH). The transcript levels were expressed as mean ± standard deviation (SD) of three independent
experiments (n=4). B: Protein expression of m-calpain was analyzed using western blotting. The protein levels were quantified with band density.
The protein levels were presented as mean ± standard deviation (SD) of three independent experiments (n=4). ###p<0.001 statistically
significant different from CTL. *p<0.05, **p<0.01, ***p<0.001 statistically significant different from Se. CTL: normal control,
Se: selenite-treated, FH80: selenite/FH-treated (80 mg/kg), Cur80: selenite/curcumin-treated (80 mg/kg).
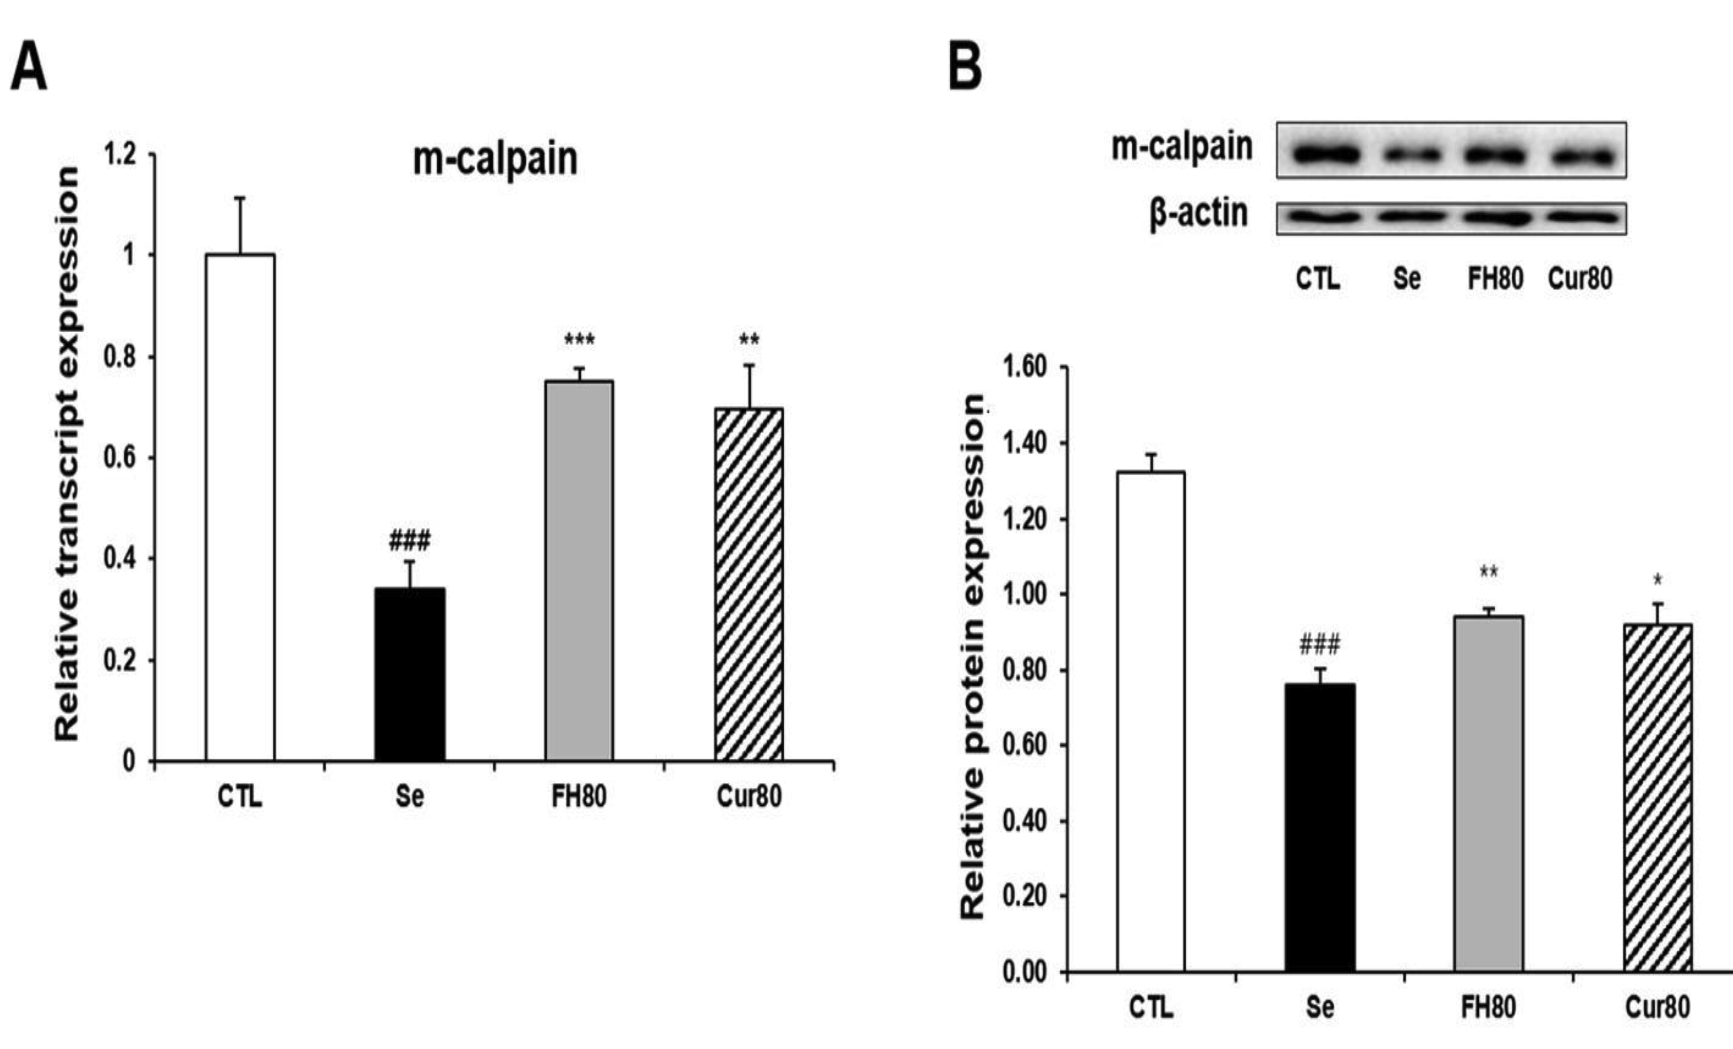
 Figure 3 of
Choi, Mol Vis 2019; 25:118-128.
Figure 3 of
Choi, Mol Vis 2019; 25:118-128.