Figure 4. Abbott–Firestone curves for the atomic force microscopy (AFM) images of the surfaces of the eight human lens capsules. The
curve represents the bearing ratio curve, which signifies the percentage of the material traversed in relation to the area
of coverage. The vertical axis represents the measured heights and depths of the surface, and the horizontal axis depicts
the bearing ratio in percentage.
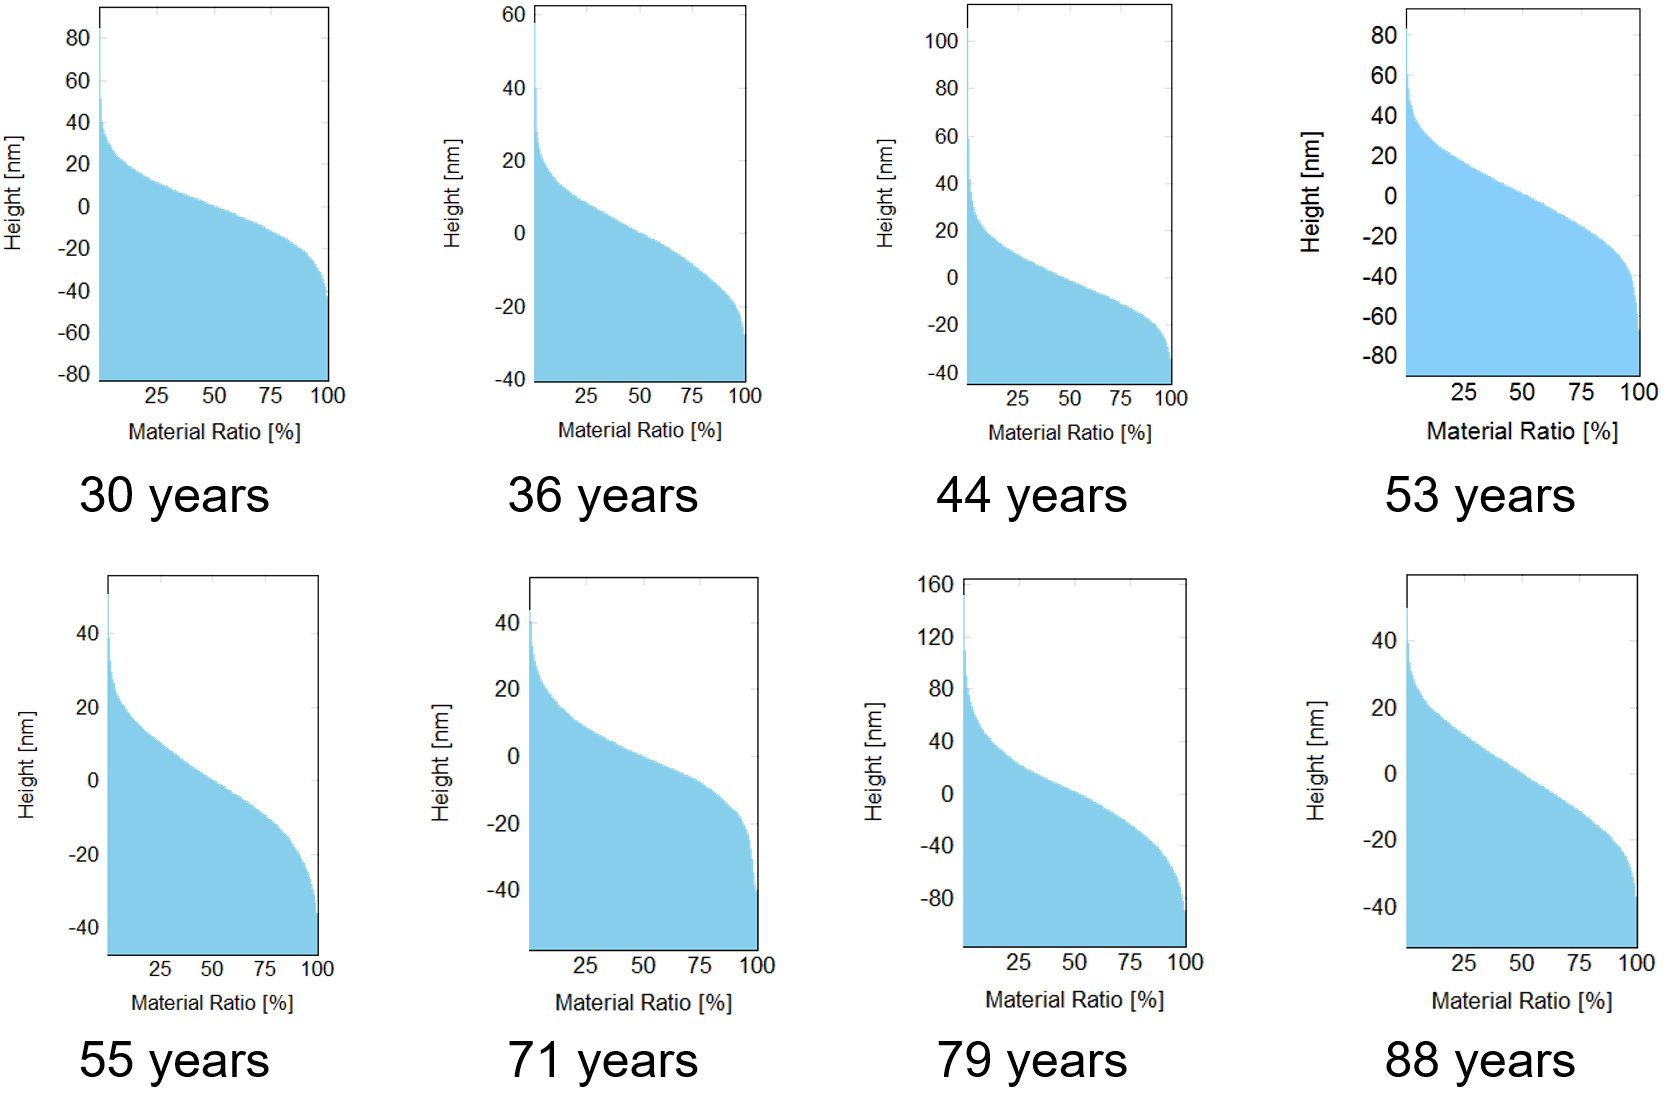
 Figure 4 of
Ţălu, Mol Vis 2018; 24:902-912.
Figure 4 of
Ţălu, Mol Vis 2018; 24:902-912.