Figure 3. Height distribution histograms with integration curve of the histogram for the atomic force microscopy (AFM) images of the
surfaces of the eight human lens capsules. The horizontal axis is graduated in depth, while the vertical axis is graduated
in percentage of the whole population of data.
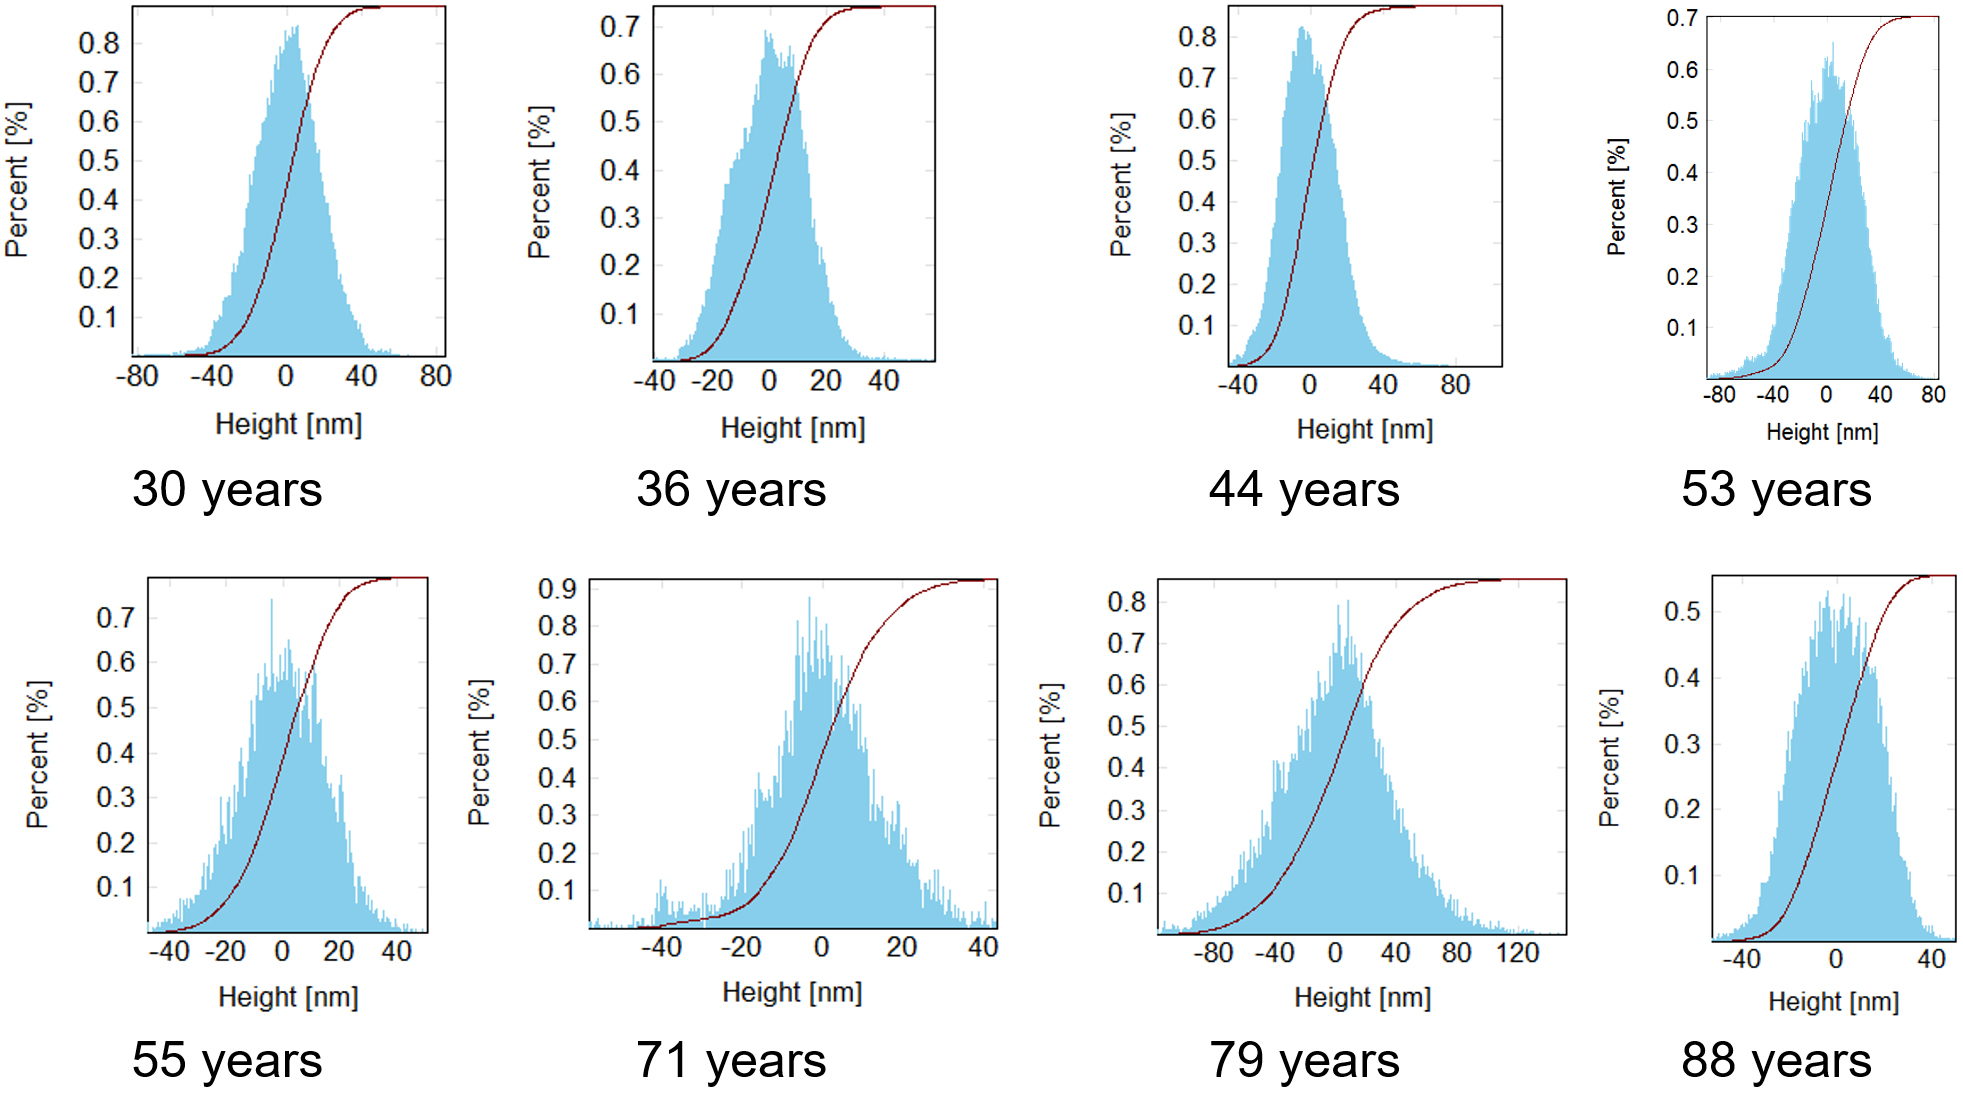
 Figure 3 of
Ţălu, Mol Vis 2018; 24:902-912.
Figure 3 of
Ţălu, Mol Vis 2018; 24:902-912.