Figure 3. Age-related association of protein concentration in AH. The association is expressed as the protein concentration (mg ml−1) versus the patient’s 5-year age intervals. Note that the straight lines are nearly horizontal, and the corresponding slopes
are near zero, showing no age correlation. Data are presented as mean ± standard error of the mean (SEM).
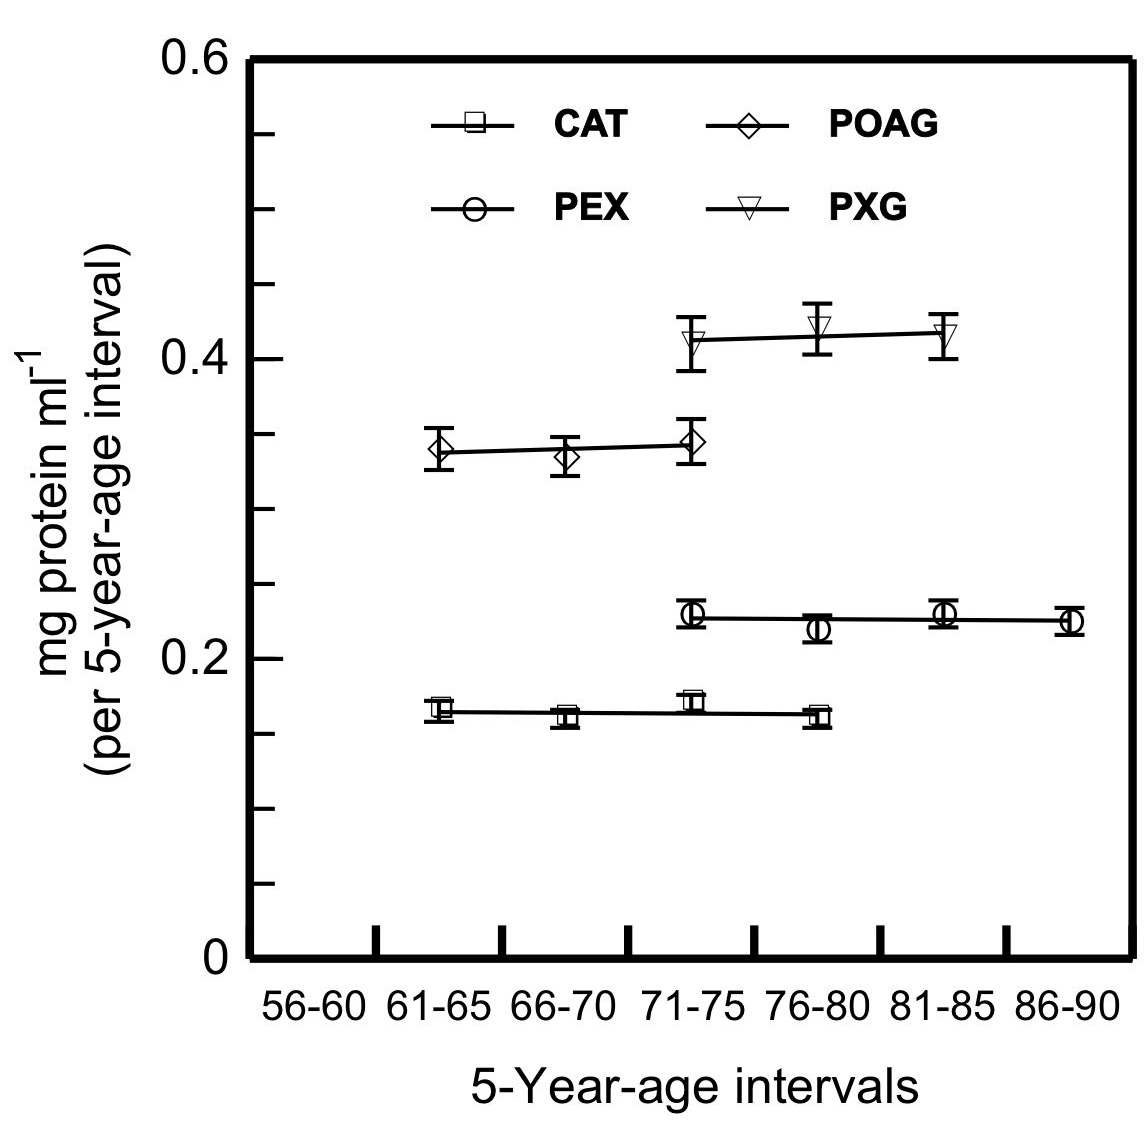
 Figure 3 of
Papadopoulou, Mol Vis 2018; 24:890-901.
Figure 3 of
Papadopoulou, Mol Vis 2018; 24:890-901.