Figure 1. Age-related association of protein carbonyls in aqueous humor (AH). The association is expressed as a linear function of the
change (rate) in the protein carbonyl concentration (nmoles ml−1 and mg−1 in A and B, respectively) versus the patient’s 5-year age intervals. Data are presented as mean ± standard error of the mean (SEM).
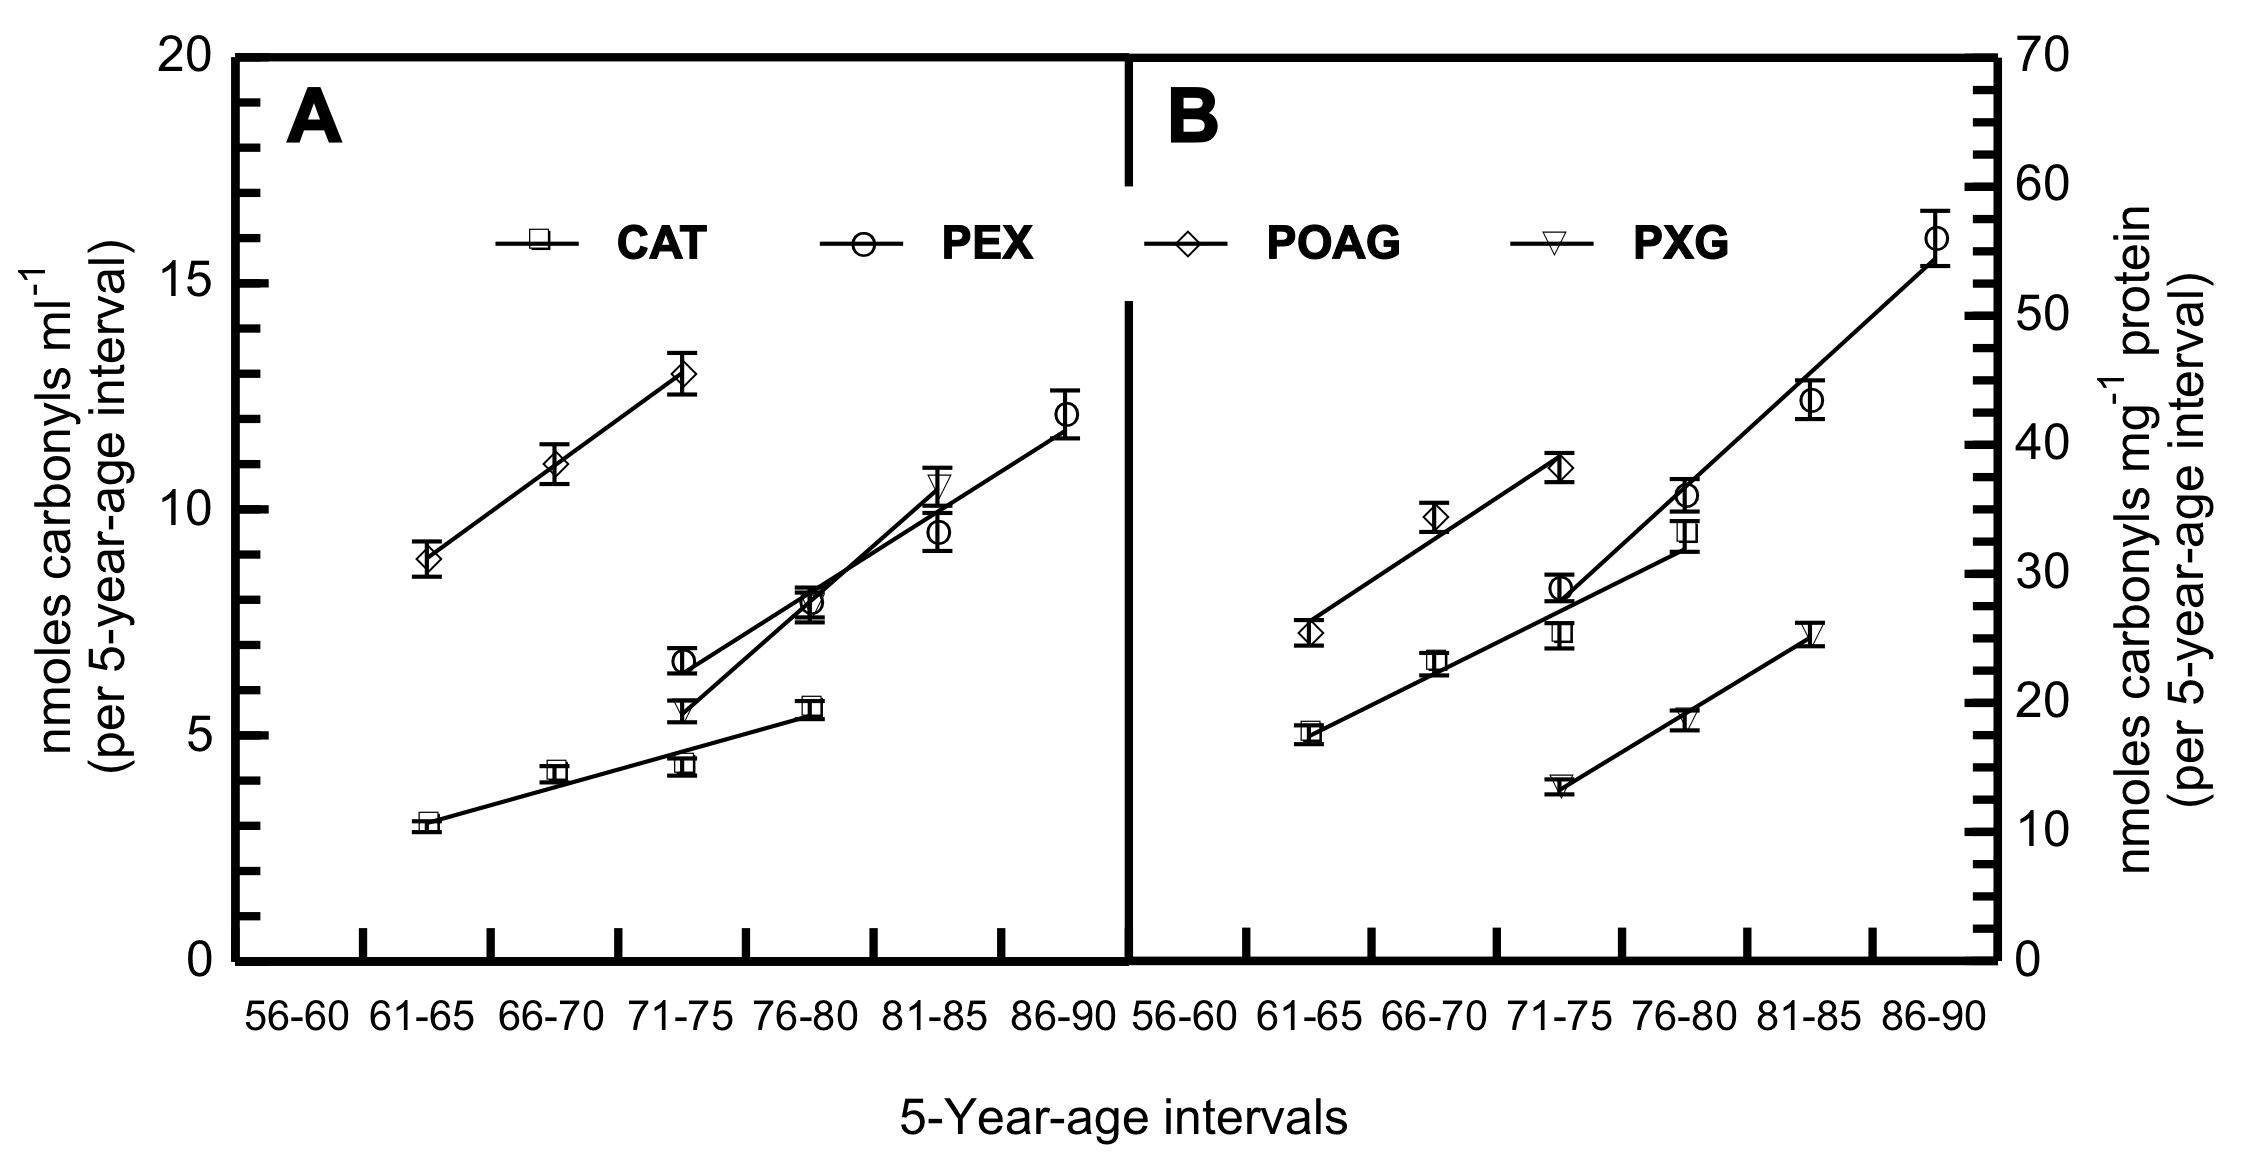
 Figure 1 of
Papadopoulou, Mol Vis 2018; 24:890-901.
Figure 1 of
Papadopoulou, Mol Vis 2018; 24:890-901.