Figure 7. Ingenuity pathway analysis (IPA) Core Analysis downstream effects depicts protein enrichments within our total retinal phosphoproteome
across the top five retina-specific components of a larger network of proteins categorized within IPA under “Ophthalmic Disease”.
These proteins can be found in Appendix 1. Each protein network is displayed by individual function (the single item listed
on the right side) and geographic distribution within the cell. These graphics are intended to aid researchers to identify
proteins of interest as they relate to ophthalmic pathologies. The five retinal networks are: (A) Abnormal morphology of the retina; # of molecules: 99, P < 4.28E-08. B: Abnormal morphology of photoreceptors; # of molecules: 50, P < 8.36E-09. C: *Retinal Degeneration; # of molecules: 71, P < 4.09E-06. D: *Degeneration of photoreceptors; # of molecules: 42, P < 2.27E-06. E: Abnormal electrophysiology of the eye; # of molecules: 46, P < 6.52E-09. *graphic contains proteins with z-scores high enough
for IPA to predict signaling effects (blue lines, which also represent an inhibitory effect), whereas gray lines reflect no
predicted effect, and yellow lines indicate findings are inconsistent with the state of downstream molecule. Color intensity
of protein node reflects expression ratio magnitude (here, Sequest-HT score).
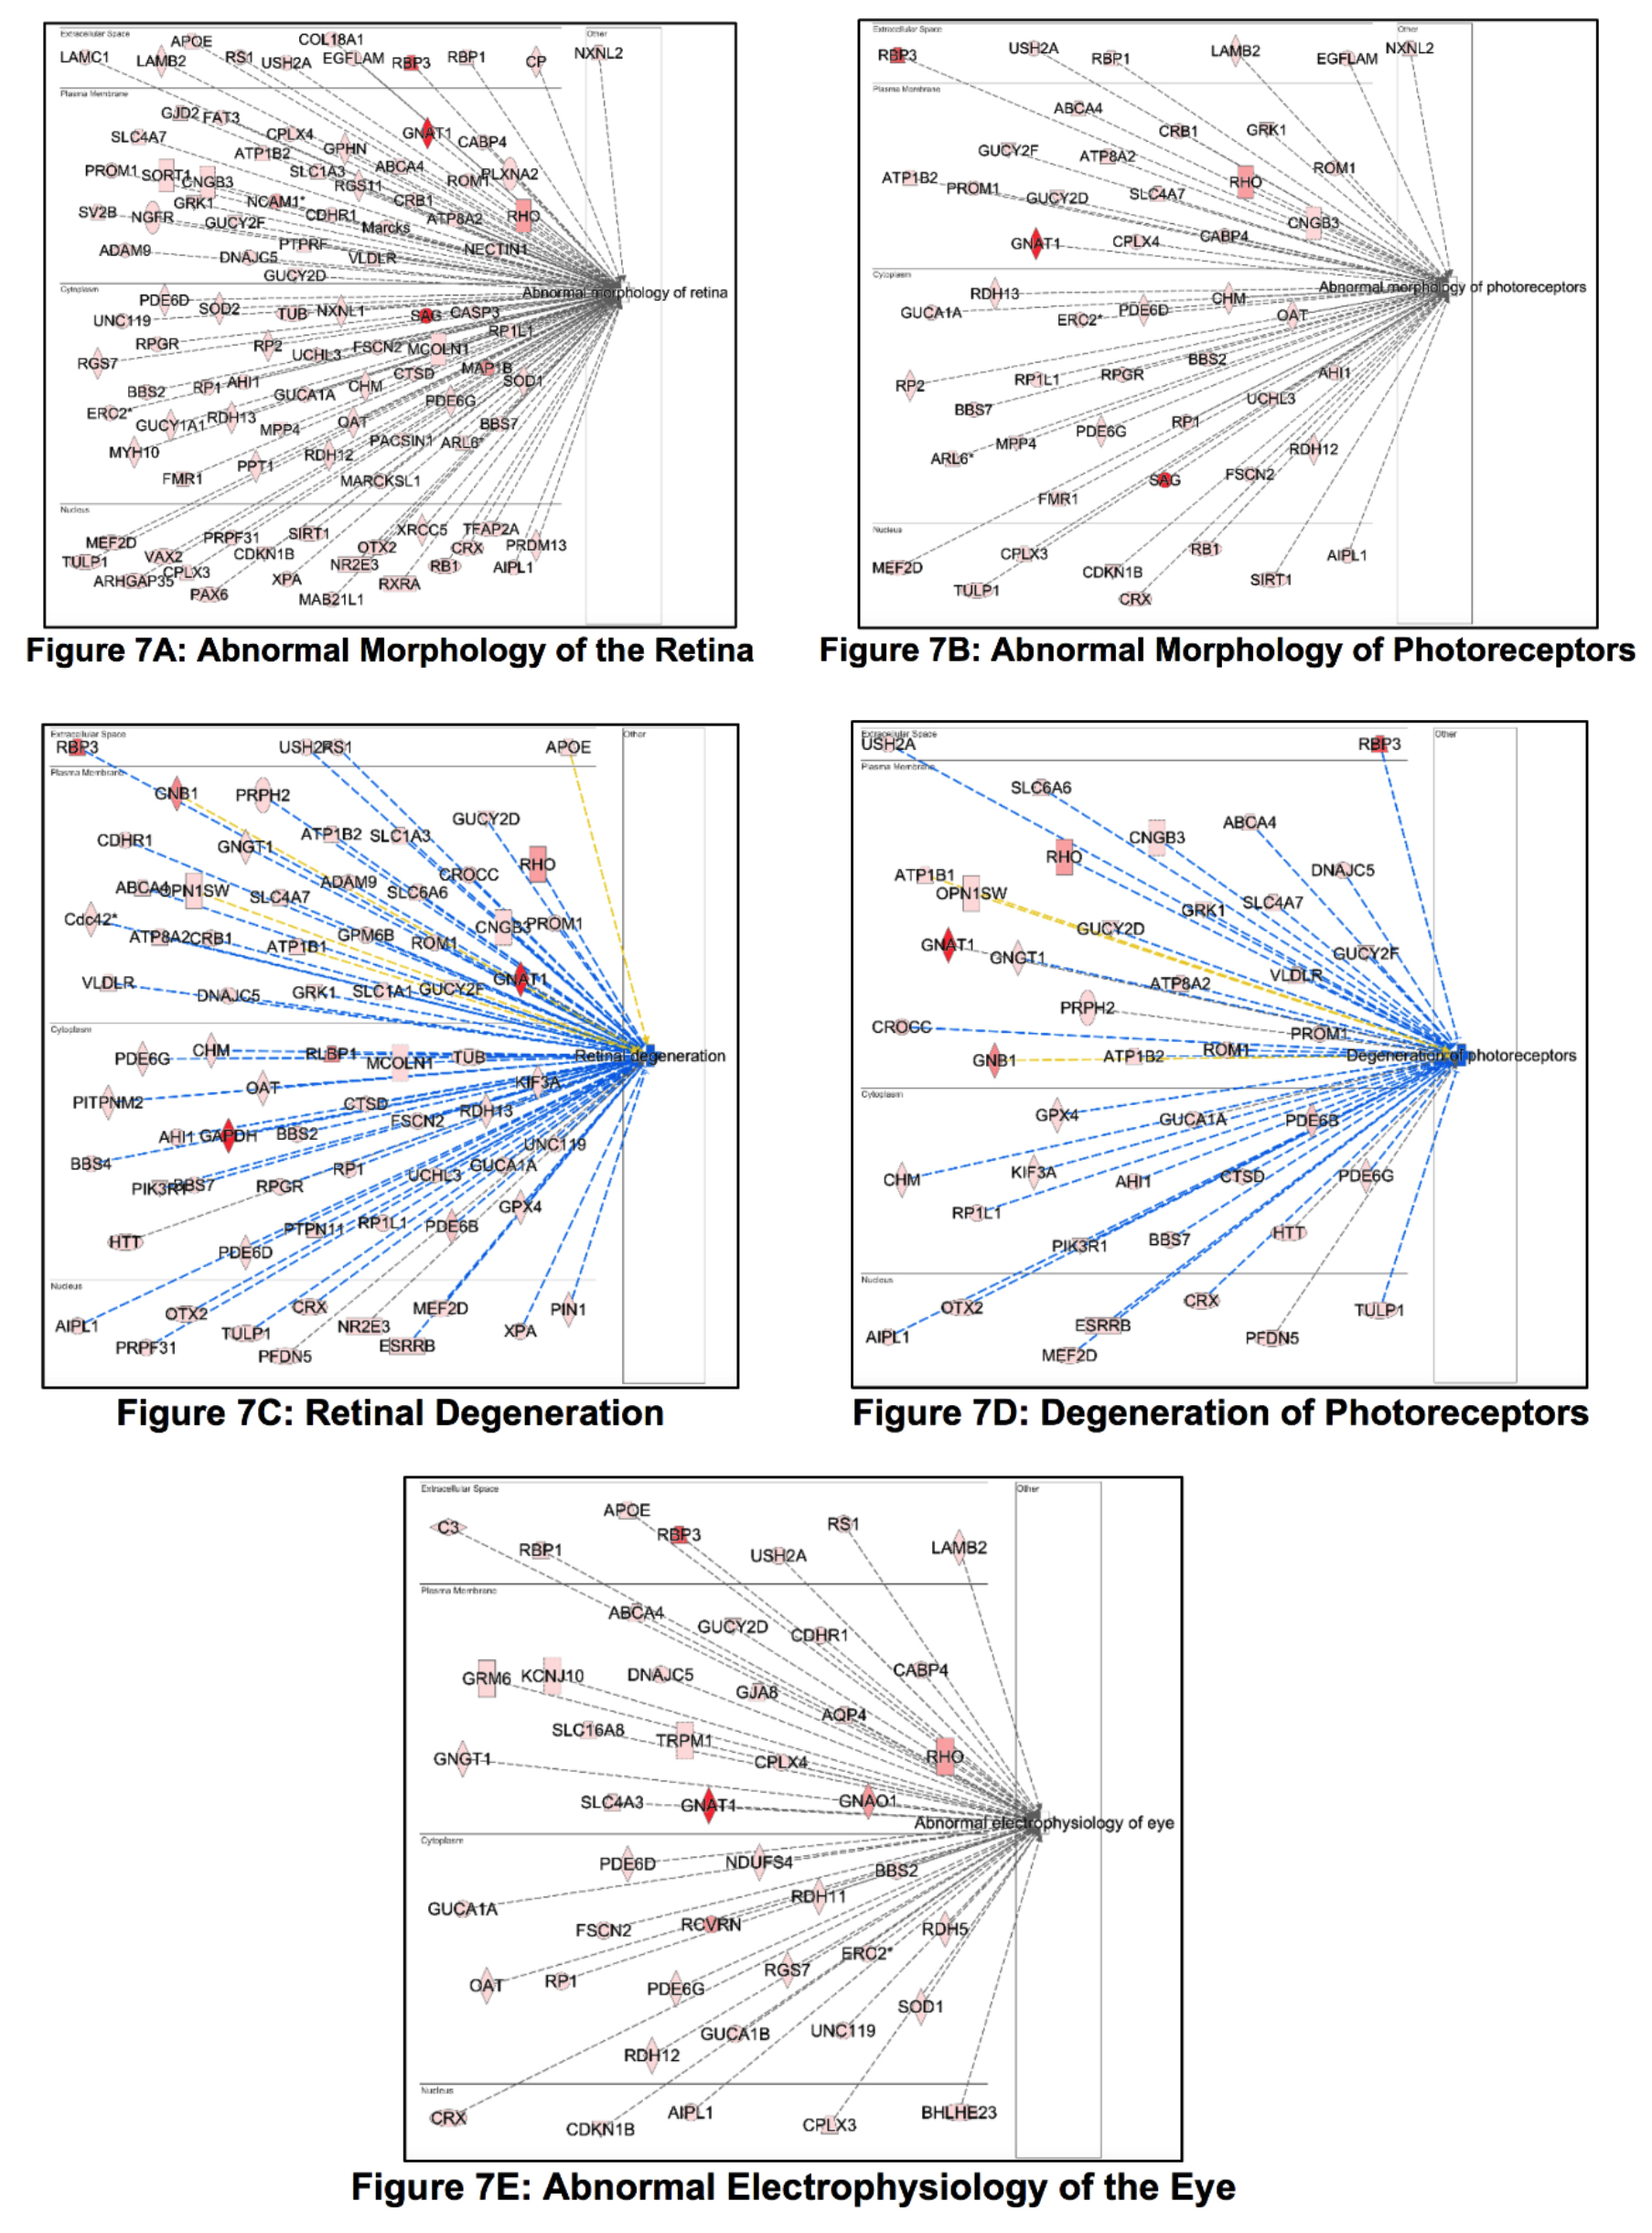
 Figure 7 of
Harman, Mol Vis 2018; 24:875-889.
Figure 7 of
Harman, Mol Vis 2018; 24:875-889.