Figure 6. Ingenuity pathway analysis (IPA) core analysis downstream effects reveal diseases and functions network enrichments. This
figure is based on proteins identified in the dataset and their known (published) regulatory associations across the following
categories: (A) Diseases and Disorders Enrichment; (B) Cellular and Molecular Functions Enrichment; and (C) Physiological System Development and Functions, related specifically to Ophthalmic Diseases. Bar graphs illustrate the “p-value
of overlap” of the proteins in our dataset relative to the IPA’s predefined categories. Each histogram bar can be expanded
into larger canonical signaling networks within the software for further details including protein-protein interactions (both
upstream and downstream from a selected node), as well as their respective geographic distributions within the cell. A detailed
table of this information has been provided as Appendix 1.
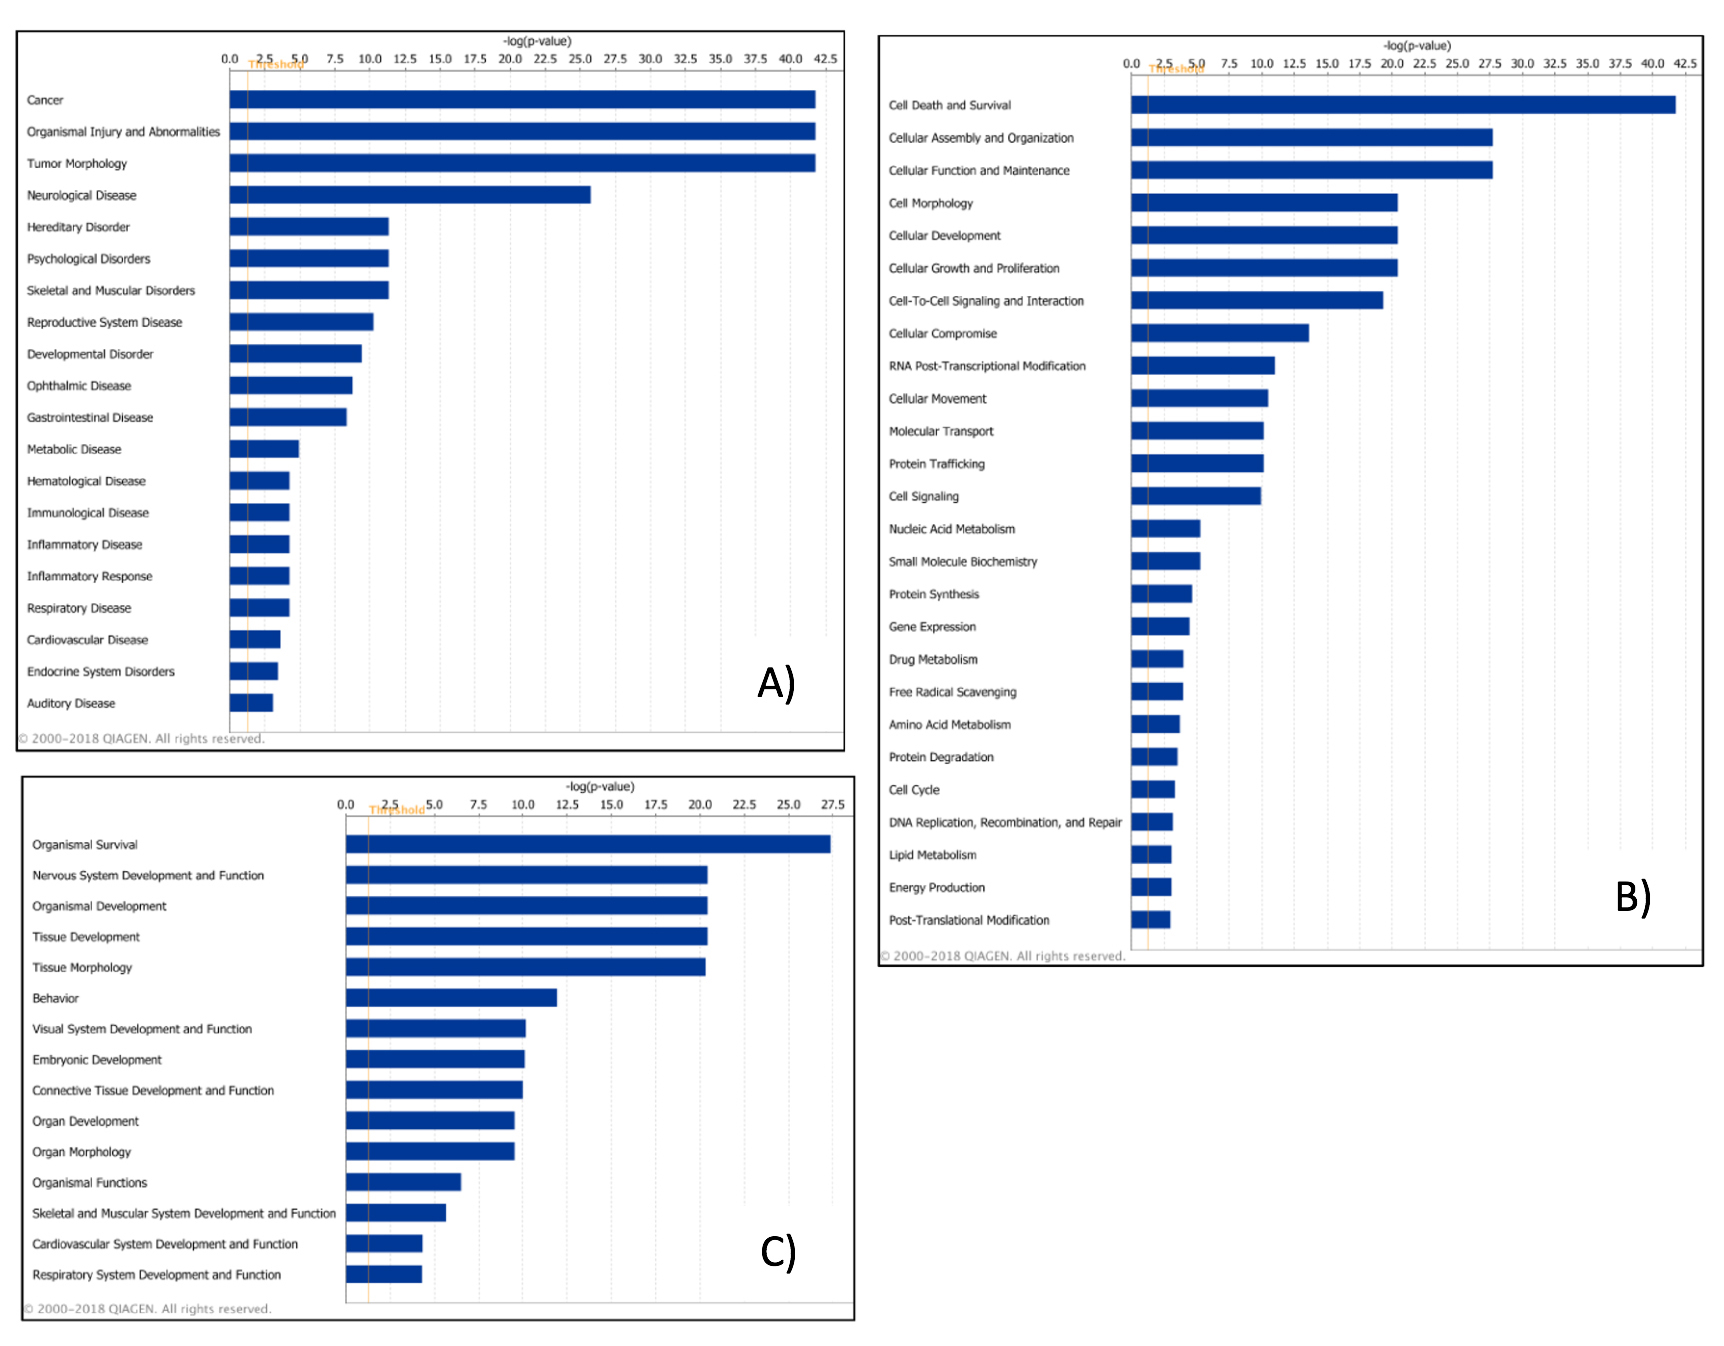
 Figure 6 of
Harman, Mol Vis 2018; 24:875-889.
Figure 6 of
Harman, Mol Vis 2018; 24:875-889.